
Atypical frontotemporal lobar degeneration with ubiquitin-positive inclusions (aFTLD-U) is neuropathologically characterized by aggregation of the FET family of proteins and clinically manifests as sporadic young-onset frontotemporal dementia. Here we describe a major risk locus on chr15q14 identified through a genome-wide association study in 59 pathologically confirmed aFTLD-U cases and 3,153 controls (lead single nucleotide polymorphism rs549846383, P = 5.85 × 10⁻²¹, odds ratio 26.7). When combined with data from 28 additional aFTLD-U cases, 3,712 controls and 3,215 individuals with other neurodegenerative diseases and by leveraging in-house and public long-read genome sequencing data from 1,715 individuals, we identified a tandem repeat expansion on the associated haplotypes in an intron of GOLGA8A. We found variation in repeat length, motif length, and motif sequence, with long CT-dimer expansions strongly associated with aFTLD-U. Although the functional consequence of this repeat remains unknown, its presence in nearly 60% of aFTLD-U cases points to a fundamental role in disease pathogenesis.
Frontotemporal dementia (FTD) is a common form of early-onset dementia marked by changes in behavior, language and/or motor function. In individuals 45–64 years of age, the point prevalence varies across studies from 0.02 to 0.22 per 1,000 persons1,2. FTD is most often caused by an underlying frontotemporal lobar degeneration (FTLD), with subtypes defined on the basis of the aggregating proteins, with misfolded tau (FTLD-tau) and TAR DNA-binding protein 43 (FTLD-TDP) comprising the largest neuropathological subgroups. The remaining 5–10% of individuals with FTLD show pathological inclusions composed of all three proteins of the FET family (FTLD-FET), that is, fused in sarcoma (FUS), Ewing’s sarcoma protein (EWS) and TATA-binding protein-associated factor 15 protein (TAF15)3.
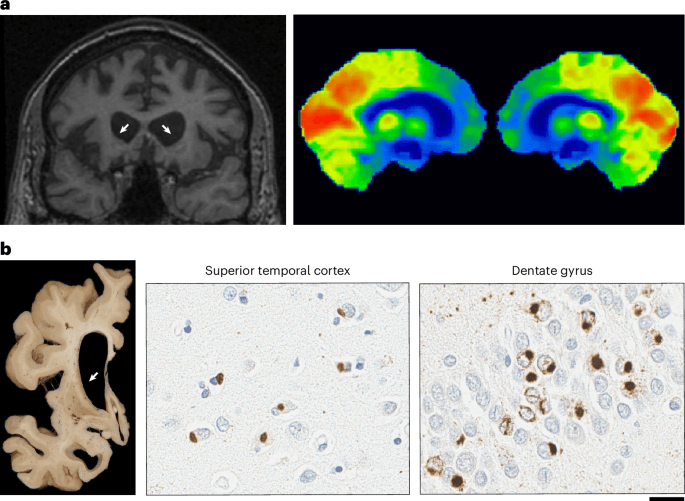
Genes with a causal role have been identified in FTLD-tau and FTLD-TDP, but not in FTLD-FET. Nearly all individuals with this rare disease subtype lack a family history of a similar illness. FTLD-FET can be further divided into atypical FTLD with ubiquitinated inclusions (aFTLD-U), neuronal intermediate filament inclusion body disease (NIFID) and basophilic inclusion body disease (BIBD) based on differences in the morphology, subcellular localization and anatomic distribution of FET inclusions and other aggregating proteins4,5. aFTLD-U is the most common subtype and stands out for its characteristic clinical presentation that typically afflicts individuals in the third to fifth decades with severe behavioral variant FTD (bvFTD), often with pronounced psychiatric disturbance and sparing of language and motor functions6. Based on this clinical presentation and the distinct feature of extensive caudate atrophy on magnetic resonance imaging, aFTLD-U can be suspected during a person’s lifetime, but a definitive diagnosis can only be obtained using immunohistochemical analysis at autopsy (Fig. 1).
a, Neuroradiology of aFTLD-U. Bilateral frontal and striatal atrophy (white arrows) is observed with coronal T1-weighted fluid-attenuated inversion recovery magnetic resonance imaging (T1-FLAIR MRI) and bilateral frontal lobe glucose hypometabolism (indicated by blue and green labeled regions) is visible with [18F]-fluorodeoxyglucose positron emission tomography imaging of the brain. b, Representative image of neuropathology of aFTLD-U. Marked frontal and striatal atrophy is visible macroscopically. Microscopically, pathologic inclusions in aFTLD-U are immunoreactive for FUS and TAF15. Abundant, compact neuronal cytoplasmic inclusions are observed in the superior temporal cortex (anti-FUS antibody; 1:500, 11570-1-AP, Proteintech Group) and dentate gyrus (anti-TAF15 antibody; 1:500, A300-308, Bethyl Laboratories). TAF15-immunoreactive vermiform intranuclear inclusions are regularly observed in the dentate gyrus of aFTLD-U cases. Scale bar, 20 μm.
A schematic of our study is presented in Extended Data Fig. 1. We established an international consortium to assemble a large cohort of aFTLD-U cases. We identified a major associated locus at chr15q14 using a common variant genome-wide association study (GWAS) in 59 aFTLD-U cases and 3,153 controls. We leveraged long-read genome sequencing data from more than 1,700 individuals, which led to the identification of a tandem repeat expansion in an intron of the GOLGA8A gene on two associated haplotypes, with extensive variation in repeat length, motif length and motif composition. CT-dimer-rich repeat expansions were strongly associated with aFTLD-U, while CCTT and CCCTCT expansions were also observed in the general population and did not confer aFTLD-U risk.
Identification of aFTLD-U associated variants at chr15q14
We performed a single variant GWAS using REGENIE7 comparing 59 neuropathologically confirmed aFTLD-U cases and 3,153 controls passing quality control and identified a strongly associated locus at chr15q14 with rs549846383 as the lead variant (P = 5.85 × 10⁻²¹, odds ratio (OR) 26.7, TTTTT > TTTT indel) (Fig. 2a and Supplementary Figs. 1 and 2). This variant was one of 38 genome-wide significant variants at chr15q14 (Fig. 2b), and its minor allele was found in 49.15% (29/59) of aFTLD-U cases compared with only 1.40% (44/3,152) of controls. A similar low frequency was observed in FTLD-TDP cases (7/507; 1.38%)8. No additional loci reached genome-wide significance.
a, Manhattan plot showing the result of the GWAS performed using REGENIE for aFTLD-U with a highly significant locus at chr15q14, with 38 genome-wide significant variants. b, Visualization of associated variants at chr15q14 based on the GWAS performed using REGENIE, with segmental duplications marked with gray bars. c, Schematic visualization of the chr15q14 locus, showing GOLGA8A and GOLGA8B, the haplotypes we have identified, and the variants identified by GWAS that tag those haplotypes. The segmental duplications with the highest identity are shown in orange, leading to low mappability for short-read sequencing. A frequent deletion overlapping GOLGA8A and GOLGA8B is shown with a red bar, with genomic coordinates according to the HPRC assemblies11 (chr15:34416680–34568563, data accessed through the UCSC genome browser track). d, Horizontal bar chart representing frequencies (as shown by color) and absolute number of carriers with associated haplotypes in pathologically confirmed aFTLD-U and control individuals, with individuals with missing genotypes removed.
The chr15q13-14 region contains pairs of segmental duplications of GOLGA genes9,10, with rs549846383 telomeric of GOLGA8B (Fig. 2c). GOLGA8A and GOLGA8B are 98.9% identical, which complicates analysis using short-read sequencing because of ambiguous read alignments. In agreement with the HPRC assemblies11, we identified copy number variation (CNV) at the GOLGA8A–GOLGA8B locus but without disease association (Supplementary Note). A pangene visualization of 472 haplotypes demonstrates the existence of several configurations, with gains, losses and putative gene conversion events12 (Supplementary Fig. 3).
We next performed a conditional GWAS by excluding rs549846383 minor-allele carriers, without filtering variants on Hardy–Weinberg equilibrium (HWE) owing to the common GOLGA8A-B CNV. The top result from this analysis, comparing 30 aFTLD-U cases with 3,108 controls, highlighted an independent association signal at chr15q14 for rs148687709 (P = 3.35 × 10⁻⁵, OR 4.7) with 40.00% of the remaining cases (n = 12/30) and 5.73% (n = 178/3,108) of the remaining controls carrying the minor C-allele (Supplementary Figs. 4 and 5). rs148687709 was also strongly associated with aFTLD-U in the original GWAS (P = 2.65 × 10⁻¹⁸, OR 7.11). In the overall cohort, carriers of rs549846383 form a subset of those with rs148687709, suggesting that rs148687709 tags a haplotype ancestral to the one on which rs549846383 occurred. We refer to the initially discovered haplotype tagged by the minor allele of rs549846383 as haplotype A and refer to the haplotype tagged by the minor allele of rs148687709 (with major allele of rs549846383) as haplotype B (Fig. 2c). Based on gnomAD, the minor alleles of rs549846383 and rs148687709 are most frequently found in non-Finnish European populations (allele frequencies 0.7% and 4.3%, respectively) and especially frequent in the Amish population (allele frequencies 4.7% and 5.5%). As rs148687709 is within the deleted interval of the common CNV, we observed some controls with a heterozygous deletion, carrying the rs549846383 risk allele but without the minor allele of rs148687709, pointing toward a partial deletion of the GOLGA8A-B locus on the associated haplotype. The opposite was observed for one aFTLD-U case with a deletion, who appeared homozygous for the rare allele of rs148687709, despite being heterozygous for rs549846383, indicating a deletion of the GOLGA8A-B locus on the non-associated haplotype.
Sanger sequencing confirmed the rs549846383 and rs148687709 genotypes observed in our aFTLD-U population and controls and allowed screening of an additional Mayo Clinic control cohort (n = 1,002), confirming the low frequency of haplotypes A and B: 16 haplotype A carriers (1.6%) and 60 haplotype B carriers (6.0%). Genotyping of an additional 28 aFTLD-U cases identified 9 haplotype A carriers and 1 haplotype B carrier. Together, in our combined cohort of 87 aFTLD-U cases with DNA available, 38 cases (43.7%) carried haplotype A, 13 cases (14.9%) carried haplotype B, and 36 cases (41.4%) carried neither of the chr15q14 risk haplotypes (Fig. 2d).
A tandem repeat expansion underlies the association signal
To further characterize the complex chr15q14 locus, we leveraged long-read genome sequencing data from brain tissue from 283 individuals, mostly FTLD-TDP cases and controls, generated as part of ongoing projects. By chance, this cohort already included 2 haplotype A carriers (1 FTLD-TDP case and 1 control) and 14 haplotype B carriers (13 FTLD-TDP cases and 1 control) (Supplementary Table 1). We additionally performed long-read sequencing in brain tissue of 53 aFTLD-U cases (22 haplotype A, 9 haplotype B and 22 carrying neither haplotypes A or B) and 5 non-aFTLD-U individuals carrying haplotype A selected from the FTLD-TDP short-read genome sequencing cohort8 (n = 2) and the Mayo Clinic control cohort (n = 3).
Using the long reads, we confirmed that rs549846383 is in cis with rs148687709. Upon manual inspection of the alignments13, we identified an expansion of a short tandem repeat (STR) in an intron of GOLGA8A (Fig. 3a) at chr15:34,419,425–34,419,451. After repeat genotyping, we observed repeat length variation in the in-house long-read cohort (n = 341), with longer alleles in cis with the minor alleles of rs549846383 and rs148687709 and predominantly observed in aFTLD-U cases carrying haplotypes A and B (Fig. 3b). We validated the repeat lengths seen in long-read sequencing by Southern blotting (Supplementary Fig. 6).
a, Location of the GOLGA8A repeat expansion relative to the GOLGA8A MANE transcript (ENST00000359187.5) showing the location of the rs148687709 variant and the deletion. b, Length consensus with the length in nucleotides of the repeat consensus sequence of the longest allele for each individual, with a horizontal line at 100 bp (the cutoff for visualizations in c and d). c, Sequence composition plot showing a heatmap of 12-mer motif frequencies, which allows representation of dimer, tetramer and hexamer motifs but does not effectively represent pentamer motifs (observed in one patient). Each row represents a unique individual with an expanded allele (≥100 bp). The first column indicates the phenotype, with aFTLD-U patients in red, the second column indicates the chr15q14 haplotype status of the individual, with haplotype A in red, haplotype B in orange and no associated haplotype indicated in blue. d, Plot generated with aSTRonaut showing the repeat sequence for all individuals with an expanded allele (≥100 bp). Colors indicate the observed motifs, and ‘>>>’ annotations preceding the trace mark aFTLD-U patients. A dynamic version of this plot is available at https://wdecoster.github.io/chr15q14/anonymized_aSTRonaut_all.html.
We additionally performed a GWAS of aFTLD-U with the length of STRs as continuous predictor variables in the long-read sequencing cohort. A total of 318,299 STR loci passed call-rate filtering, resulting in two genome-wide significant STR loci at chr15q14. We confirmed a strong association for the length of the GOLGA8A STR at chr15:34,419,425–34,419,451 (GRCh38) with aFTLD-U (P = 1.98 × 10⁻¹³, OR 17.1). The only other genome-wide significant STR locus was an intergenic repeat polymorphism between GOLGA8A and GOLGA8B at chr15:34,480,576–34,480,608, which is on average 8 bp longer on the associated haplotypes but without expanded alleles (P = 2.02 × 10⁻¹⁶, OR 6.2; Supplementary Fig. 7). We further leveraged the long-read sequencing data to genotype all single nucleotide variants (SNVs) and structural variants (SVs) in a 500-kb window around the rs549846383 tagging variant in our cohort, concluding that there are no additional variants that could explain the association signal (Supplementary Note). Using a phylogenetic tree (Methods), we demonstrated that carriers of an associated haplotype cluster separately (Supplementary Fig. 8).
Substantial variation in repeat motif composition
Encouraged by these findings, we further investigated the associated GOLGA8A tandem repeat, which is annotated as an STR with 6.75 copies of a TTTC-motif in GRCh3814. However, in our cohort, the analysis of expanded alleles identified expansions of a CT dimer, a CCTT tetramer, a CCCTCT hexamer and CCCCT pentamer motifs. Using a 12-mer heatmap, we observed that CT dimers are found exclusively on haplotypes A and B, occurring at particularly high frequencies in aFTLD-U cases (Fig. 3c). CCTT expansions are observed only in individuals without haplotype A or B, while CCCTCT hexamer expansions are found on haplotypes A and B, but more so in non-aFTLD-U individuals. Representative examples of repeat consensus sequences can be found in Supplementary Table 2. We developed six repeat-primed polymerase chain reaction (PCR) assays with primers against the observed motifs, confirming the repeat sequences observed with long-read sequencing (Supplementary Figs. 9 and 10).
We also observed several flanking motifs, which are variable in length but short (≤20 units), including tetramers (CTTT and CCCT) and a pentamer (CCTTT) (Fig. 3d and Supplementary Fig. 11). Most expanded alleles contained variable lengths of the flanking CCTTT pentamer motif at the 5′ end; more specifically, the reference CTTT units are followed by two to six copies of CCTTT before the sequence transitions into the expanded CT-dimer stretch. All non-aFTLD-U individuals carrying haplotype B showed a short CCCT stretch flanking the 5′ end of the repeat (10–20 units), followed by a short CT stretch.
We also observed mixed repeat compositions. Two aFTLD-U cases carrying haplotype B showed expanded stretches of both CT and CCCTCT. The aFTLD-U case with the CCCCT pentamer motif also has an extended 3′ CT-dimer fragment. We also identified a non-aFTLD-U individual with a 12-mer repeat motif with motif interruptions at the 5′ end and a CT-dimer at the 3′ end of the repeat. Finally, we observed a highly remarkable CnT-rich allele in a case with haplotype B for which no clear repeat motif could be described. The repeat consensus sequence had up to 62 consecutive Cs, flanked by shorter CT-dimer stretches at the expansion ends. Although the observed long C homopolymer stretches require caution without orthogonal validation, it is noteworthy that this case was the only one with a positive family history of aFTLD-U. Unfortunately, no DNA was available from the affected mother15.
Based on these observations, we hypothesized that long expansions predominantly composed of CT dimers drive aFTLD-U risk. In particular, of the seven non-aFTLD-U individuals with haplotype A, one had a CCCTCT hexamer repeat composition, one had a 12-mer repeat and five had CT-rich repeat lengths ranging from only 149 bp up to 1,178 bp (median 433 bp; 71%). By stark contrast, all 22 aFTLD-U cases with haplotype A had long expansions ranging from 489 bp to 2,133 bp (median 760 bp; 100%).
For the 14 non-aFTLD-U individuals with haplotype B, we observed two carriers with a CCCTCT hexamer repeat composition (14.3%) and 12 carriers of a relatively short repeat primarily composed of CT ranging from 187 bp to 235 bp (median 214 bp; 85.7%). By contrast, for seven out of nine aFTLD-U cases carrying haplotype B, we found long expansions predominantly composed of CT-dimer motifs (77.8%), with lengths ranging from 484 bp to 1,245 bp (median 834 bp). The exceptions were the aFTLD-U case with the CnT-rich sequence described above and one aFTLD-U case carrying haplotype B with a short CT expansion reminiscent of those observed in non-aFTLD-U individuals (presumably with a disease etiology different than chr15q14).
Characterizing haplotype carriers in additional non-aFTLD-U cohorts
Next, we confirmed the low frequency of the haplotype-tagging variants in non-aFTLD-U by screening additional cohorts of other neurodegenerative disease cases and controls, and we selected an additional 12 haplotype A and 18 haplotype B carriers for detailed long-read sequencing analysis16,17,18,19,20,21,22,23 (Supplementary Fig. 12 and Supplementary Note). Among the 12 haplotype A carriers, 2 individuals had no expansion (16.7%) and 3 had a hexamer motif expansion (25%), whereas the other 7 had CT-rich expansions that were relatively short in 2 individuals (137 bp and 159 bp, 16.7%) and longer in the other 5 (325–940 bp, 41.7%). Immunohistochemical analyses confirmed the absence of FUS and TAF15 pathology in non-aFTLD-U individuals with a CT-rich expansion (Supplementary Fig. 13). Among the 18 haplotype B carriers, 16 had CT repeats (88.9%), but the repeat was much shorter than in aFTLD-U cases in all of them, with a mean expansion length of 211 bp and a maximum length of 261 bp. Two haplotype B carriers (11.1%) had a CCCTCT hexamer expansion.
Similar to what we observed for a subset of non-aFTLD-U haplotype A carriers, we expected to find non-aFTLD-U individuals with haplotype B carrying longer CT expansions in rare instances, suggesting that we had not sequenced sufficient haplotypes to observe these. We thus enriched for such carriers by using repeat-primed PCR for the CT motif on all 60 Mayo Clinic controls carrying haplotype B, and selecting 3 individuals with positive signals on one or both sides of the repeat, comparable to what is observed in most aFTLD-U cases with a GOLGA8A expansion. Long-read sequencing in these individuals identified longer CT-rich expansions in two (438 bp and 736 bp), with the third control having only a short CT-rich expansion (218 bp). This confirms that a subset of the non-aFTLD-U individuals carrying haplotype A or B may carry long CT-rich repeat expansions comparable to aFTLD-U cases.
Deriving cutoffs for pathogenic repeat alleles
Across all cohorts, long-read sequencing data was available for 19 non-aFTLD-U and 22 aFTLD-U haplotype A carriers and for 35 non-aFTLD-U and 9 aFTLD-U haplotype B carriers. The repeat genotypes of all 1,715 individuals for which long-read sequencing data are available are summarized in Fig. 4a. Repeat characteristics of all haplotype A and B carriers are summarized in Supplementary Table 3.
a, Scatter plot showing the repeat genotype as the percentage CT (x axis) and the consensus repeat length (y axis, with a minimum of 20 bp), with the cohort as color and haplotype as a symbol. A dotted-line box at 450 bp and 80% CT indicates proposed patient classification cutoffs. A peak of expansions at 50% CT can be seen, corresponding to expansions with the CCTT motif composition. Notable aFTLD-U outliers are indicated with an arrow, that is, the CnT-rich haplotype B carrier (blue arrow) and the haplotype A carrier with the CCCCT pentamer expansion (green arrow). b, Strip plot representing the number of CT dimer units, counted after removing all other CT-containing motifs from the repeat consensus sequence. c, Stacked horizontal bar plots of observed repeats and their frequencies (as shown by color coding) and absolute number of carriers in aFTLD-U cases and non-aFTLD-U individuals. Three possible classifications are shown depending on CT-dimer length and percentage CT content. CT-repeats (red) are shown with no length cut-off (‘any CT repeat’), considering only CT repeats >450 bp long and >80% CT, or >190 CT dimer units. CT repeats not matching these criteria are shown in light pink (short CT repeat) in the latter two classifications.
Based on the current in-house and public data, we propose that a repeat expansion of >450 bp and >80% CT content predicts aFTLD-U cases among haplotype carriers, with a precision of 0.80 (95% confidence interval (CI) 0.64–0.91) and recall of 0.90 (95% CI 0.75–0.97) (Fig. 4a). With an alternative classification, using a threshold of 190 CT-dimer motifs in haplotype carriers (after subtracting other repeat motifs; Methods) (Fig. 4b), we obtain a precision of 0.78 (95% CI 0.62–0.89) and recall of 0.94 (95% CI 0.79–1.00) for the prediction of aFTLD-U. We additionally calculated the association with aFTLD-U for each of the two repeat-based classifiers and compared this with the association with aFTLD-U of the tagging variants, using Fisher’s exact tests in the 1,715 individuals in the long-read cohort. The P values are 7.29 × 10⁻²⁵ based on rs549846383 (tagging haplotype A), 2.01 × 10⁻²⁹ based on rs148687709 (tagging haplotype A and B), 5.77 × 10−40 for the classification using the double cutoff of >450-bp expansion with >80% CT content, and 4.86 × 10−41 for the classification based on expansion alleles with >190 CT-dimer motifs. A schematic overview of the carrier frequency of the repeat based on the two classifications is provided in Fig. 4c. Additional screening of future cohorts is expected to further refine these cutoffs.
DNA samples could be collected from five unaffected relatives from three aFTLD-U cases carrying the GOLGA8A expansion (Fig. 5a). The associated haplotype was present in two unaffected relatives. Long-read sequencing showed that the repeat expansion was similar in size and composition in each family’s affected and unaffected sibling (Fig. 5b). Ultralong nanopore genome sequencing was further performed with DNA extracted from lymphoblastoid cell line (LCL) samples for the sib pair from FAM1, followed by de novo assembly and SV calling without identifying additional variation in the associated locus. From the 1000 Genomes Project cohort (FAM4), we identified one individual (HG01512) with a 804-bp pure CT expansion whose daughter (HG01514) inherited the associated haplotype. Long-read sequencing showed that repeat allele was inherited without substantial further expansion (a 907-bp pure CT expansion; Fig. 5b).
a, Pedigrees of cases and control individuals from the 1000 Genomes Project carrying an expansion for which DNA of relatives could be collected. Cases diagnosed with pathologically confirmed aFTLD-U are indicated with a black shape, and the determined chr15q14 haplotype (A, B or –/none) is shown below the symbol, where DNA was available. Individuals are labeled at the top right with numbers per family. Note that FAM2.2 was lost to follow-up around the age at onset of the affected relative with current disease status unknown, and no DNA was available from the affected mother. b, Comparison of the repeat consensus sequence among family members. Individuals are labeled with family ID, followed by the number as indicated on the top right above the symbol in a. The consensus sequences for FAM1 family members were generated from LCL-derived DNA; for FAM2, data for the affected brother were from brain-derived DNA, while DNA from the unaffected sister was obtained from blood. Both DNA samples used for FAM4 are extracted from LCLs.
The GOLGA8A repeat shows somatic length variation
We also observed considerable somatic repeat length variation with rare outliers, in agreement with the smear on the Southern blot (Fig. 6a and Supplementary Fig. 6). Visualization of individual reads shows that most of the somatic length differences are in the CT tract (Supplementary Fig. 14). Increased somatic variation, quantified as the standard deviation of repeat length, is observed for longer repeat consensus lengths and not confined to carriers of the associated haplotypes (Supplementary Fig. 15), with the case with the pentamer repeat composition being a notable exception of an exceptionally long expansion with limited somatic length variation. For a small set of cases, we additionally sequenced DNA extracted from other tissues, such as the cerebellum, caudate and occipital cortex, and LCL cultures, again identifying variation in repeat length (Supplementary Fig. 16). We did not observe a correlation between repeat lengths and age in aFTLD-U cases (Fig. 6b).
a, Strip plot showing, for each horizontal trace, the length per read for all individuals from the in-house and public long-read cohort, including every individual for whom the consensus allele is at least 100 bp. Traces are sorted vertically by the median length of the larger haplotype. Each dot is an individual read and, thus, a separate observation. The frequency of in-house non-aFTLD-U individuals with an expansion does not represent the general population, as we enriched explicitly for those in our sequencing efforts. b, Scatter plot showing the correlation of the number of CT dimer units with age at death for aFTLD-U patients for DNA extracted from the frontal cortex. The trendline, the R2 correlation coefficient and the P value were determined using ordinary least-squares regression as implemented in the statsmodels Python module.
Comparison of aFTLD-U cases with and without chr15q14 risk haplotypes
We observed a nominally significant difference in age at death (P = 0.043; Fig. 7a) between aFTLD-U cases carrying haplotype A or B and those without association to chr15q14, with a subset of those without the haplotype showing an earlier age at death. In accordance with the distribution in the whole aFTLD-U cohort (Methods), haplotype carriers also show a sex imbalance, with 71% male and 29% female cases (Fig. 7b).
a, Comparison of age at death. Two-sided t-test between haplotype A or B carriers and those without haplotypes A or B (none): P = 0.043. The aFTLD-U case carrying haplotype B but no GOLGA8A expansion, as determined by long-read sequencing, is in gray. b, Comparison of sex at birth across haplotypes in aFTLD-U cases.
No role for chr15q14 haplotypes in NIFID and BIBD
We next screened 23 individuals with NIFID and 11 with BIBD for the presence of chr15q14 risk haplotypes, identifying only 3 NIFID with haplotype B. Long-read sequencing was performed for one of these, showing a length (221 bp) and composition of the GOLGA8A repeat highly similar to non-aFTLD-U individuals with haplotype B (short CCCT and CT stretches). Insufficient DNA was available for long-read sequencing for the remaining haplotype B carriers.