
Influenza viruses cause epidemics that result in hundreds of thousands of deaths annually and occasional pandemics that can be much more severe3. Current influenza vaccines offer only partial protection due to multiple factors, including viral escape from immune memory driven by genetic mutation or antigenic drift. Antigenic drift is exacerbated because the most protective antibodies target the globular head of haemagglutinin (HA), which mediates viral attachment but is more mutagenic, driving escape4,5,6. In comparison, the HA stalk, which mediates membrane fusion4, is highly conserved but less immunogenic7,8,9. First described as original antigenic sin, which is deleterious, or now as immune imprinting, which also accounts for beneficial effects, immune responses to viruses are biased in various ways by previous exposure to similar strains1,2. Imprinting by pre-existing serum antibodies can competitively shift future responses through epitope masking effects or other mechanisms such as Fc-receptor-driven modulation of immunity10,11,12. Imprinting may also result predominantly from residual memory after the virus mutates key epitopes or from precursor–product relationships, affecting future targeting of evolved epitopes. Memory B cells have typically undergone affinity maturation to refine antibody binding and specificity13, and also respond more rapidly and vigorously14,15. Thus, imprinting often causes biased induction of B cell memory to less-protective epitopes of past influenza virus strains in people16,17 or in model systems18,19,20. These imprinted responses often show effects from childhood exposure decades earlier17,21,22,23 so that immune history to influenza often predicts future risk24,25,26,27. Evidence for altered susceptibility to influenza infection based on childhood exposures1,17,21,22,23,24,25,26,27 has led to conjecture that childhood immune responses are uniquely susceptible to imprinting, although there is also clear evidence that imprinted immune responses can initiate in adults10,28,29.
Here we address possible origins of immune imprinting by linking B cell receptor to antigen specificity by sequencing (LIBRA-seq)30, monoclonal antibody characterization and structure–function analysis. B cells from young children were studied after primary infections with H3N2 and then H1N1 influenza viruses, or vice versa, and compared with those from adults or children after H1N1 infections. Although the primary B cell response in children is phenotypically similar to that in adults, some gene expression differences were observed. Children target a similar spectrum of epitopes on HA as adults, but adult B cells appear to be substantially influenced by immune imprinting. After consecutive primary heterosubtypic infections, 4–6% of memory B cells in children are cross-group reactive. These imprinted B cells target the central stalk epitope of HA and exhibit major functional differences. Primary H3N2 followed by H1N1 virus infections reduced the breadth and potency of isolated H1/H3 cross-neutralizing monoclonal antibodies in a near-comprehensive manner. In the shared stalk epitope, a single amino acid in the imprinting H3 and affected H1 strains differed from most historic H1 strains (D46N), differing by only an atomic group (carboxylic acid versus amide) but accounting for most of the altered antibody binding. Thus, imprinting occurred because residual memory B cells predominantly targeted epitopes shared by past strains, with only a single atomic group driving major reactivity shifts against a key, conserved epitope.
Comparing B cells in children and adults
To investigate the basis of immune imprinting, we collected blood samples from children aged 2–6 years after sequential first-time (primary) exposures to heterosubtypic influenza viruses, including 13 children with H3N2 followed by H1N1 infections (H3–H1) and seven children with the inverse order of infections (H1–H3) (Fig. 1a). For comparison, we also included eight children with first-time H1N1 infections (H1-only) and 12 adults with H1N1 infection (adult H1) (Fig. 1a and Extended Data Table 1). Samples were collected at symptom onset (acute) and after memory B cell responses developed 4–8 weeks later (convalescent). Acute and convalescent serum IgG titres against H1 and H3 recombinant proteins confirmed exposure histories for all participants (Fig. 1b). Consistent with a previous study31, cross-subtype boosts in serum antibodies were observed in most children from the H3–H1 and H1–H3 groups (Fig. 1b). HA-specific B cells were bait-sorted with oligonucleotide-barcoded probes for 10x Genomics single-cell RNA sequencing (scRNA-seq), following a laboratory-adapted protocol similar to LIBRA-seq30 (Extended Data Fig. 1a). The probes included a panel of HAs from various seasonal influenza viruses, including strains from the years of infection, plus a chimeric HA (cH8/1) with an H1 stalk and an irrelevant avian H8 head to identify HA-stalk-binding B cells (Supplementary Table 1). All four groups showed increases in the percentages of HA-specific B cells from the acute (0.043–0.077%) to the convalescent (0.11–0.27%) phases, with the increase more pronounced in adults (Extended Data Fig. 1c,d). The 5′ transcriptome, B cell receptor (BCR) immunoglobulin V(D)J gene repertoire, and surface feature barcode profile were determined for 3,117 HA-specific B cells. HA antigen specificity predicted by LIBRA-seq probe scores was validated by expressing 150 recombinant monoclonal antibodies from synthesized variable gene cDNAs and testing them by enzyme-linked immunosorbent assay (ELISA). Expectedly, LIBRA-seq probe scores and monoclonal antibody binding were highly correlated (0.69 < R < 0.81, P < 0.0001) (Fig. 1c and Extended Data Fig. 2). To characterize these monoclonal antibodies thoroughly, we examined their antigen reactivity, neutralization capability, epitope specificity and molecular interactions with cognate and divergent HAs.
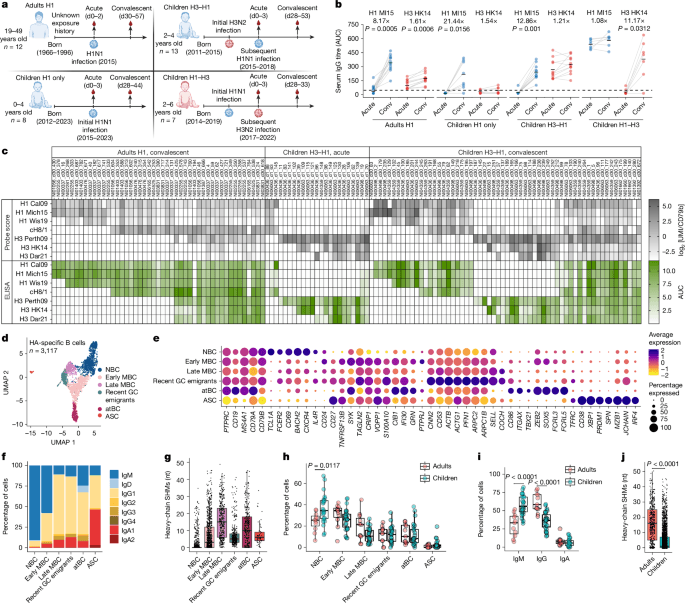
a, Exposure history and sample collection overview for children and adults after H1N1 (blue) or H3N2 (red) virus infections. The diagram was created using BioRender; Wilson, P. https://BioRender.com/43b489t (2026). d0, day 0. b, Serum IgG titres against Mich15 H1 and HK14 H3 were measured by ELISA area under the curve (AUC); fold change in the geometric mean (as a straight line) is shown at the top. n = 12 (adult H1), n = 8 (children, H1 only), n = 11 (children H3–H1), n = 7 (children H1–H3). Statistical analysis was performed using two-sided Wilcoxon matched-pairs signed-rank tests. Conv, convalescent. c, Predicted antigen specificity (probe scores in grey) of HA-specific B cells in the adult H1 and children H3–H1 groups, as well as validated antigen specificity (ELISA AUC in green) of corresponding monoclonal antibodies (mAbs). UMI, unique molecular identifier. d, Seurat uniform manifold approximation and projection (UMAP) of HA-specific B cells from all individuals and timepoints combined. e, Expression of genes of interest in each annotated B cell subset. The B cell subset with transcriptional signatures of recent GC emigrants (upregulation of genes associated with cytoskeleton remodelling, including ACTB, ACTG1, PFN1 and ARPC2) is identified. f,g, The percentages of isotype (f) and heavy-chain SHMs (g) of HA-specific B cells in each B cell subset. nt, nucleotides. h,i, The percentages of HA-specific B cells in each B cell subset (h) and isotype (i) between adults and children. n = 11 (adults) and n = 26 (children). Statistical analysis was performed using two-sided unpaired Mann–Whitney U-tests. j, Heavy-chain SHMs of HA-specific B cells between adults and children. n = 466 cells (adults) and n = 2,637 cells (children). Statistical analysis was performed using two-sided unpaired Mann–Whitney U-tests. The results in b and c represent the average of two technical replicates from one out of two independent experiments. The box and whisker plots in g–j show first quartile (lower bound of the box), mean (centre line) and third quartile (upper bound of the box), and the whiskers extend to the minimum/maximum values within 1.5× of the interquartile range.
A long-standing hypothesis is that the immune system of young children is uniquely susceptible to immune imprinting. To gain insights into this issue, we conducted an integrated analysis of single-cell transcriptomes from HA-specific B cells alongside over 128,000 total CD19+ B cells from all participants to compare B cell subsets identified by transcriptional clusters (Fig. 1d,e and Extended Data Figs. 1b and 4a,c). On the basis of the top 10 differentially expressed genes (DEGs), gene set enrichment analysis (GSEA) on the DEGs and the expression of known marker genes, we identified six major B cell differentiation subsets, including transitional B cells (TBCs), naive B cells (NBCs), both early and late memory B cells (MBCs), recent germinal centre (GC) emigrants, atypical B cells (atBCs) and antibody-secreting cells (ASCs) (Extended Data Figs. 3d,h and 4d). The B cell subsets were further validated by BCR profiling. Specifically, early-MBCs had lower levels of class-switching and somatic hypermutations (SHMs) (46.7 ± 9.9%; 7.6 nucleotides) compared with late-MBCs (89.1 ± 8.5%; 16.3 nucleotides), while recent GC emigrants were predominantly class-switched but exhibited low levels of SHMs (91.2 ± 7.9%; 7.9 nucleotides) (Fig. 1f,g). atBCs were also observed in children after the first infection (H1-only) with low levels of class-switching and SHMs (38.5 ± 8.9%; 3.1 nucleotides), suggesting that they can arise from activated B cells and early/late-MBCs (Extended Data Fig. 3e,f). Among total CD19+ B cells, there were slightly more TBCs and fewer late-MBCs in children (TBCs, 12 ± 5%; late-MBCs, 5.5 ± 4.3%) compared with adults (TBCs, 5.7 ± 3%; late-MBCs, 12.7 ± 7.1%), which is expected as children should have less immunological history (Extended Data Fig. 4b). All subsets of HA-specific B cells were comparable between adults and children, with more NBCs (adults, 24.2 ± 8.9%; children, 36.4 ± 13.5%) and fewer MBCs in children (adults, 50 ± 11.6%; children, 37.6 ± 8.3%) (Fig. 1h). Certain genes were upregulated in children (IFI44L, SOX5, FCRL3 and CD38), suggesting subtle transcriptional differences between adults and children within particular B cell subsets (Extended Data Fig. 3a–c). The immunoglobulin variable (IgV) genes from children’s HA-specific B cells were less frequently class-switched and had fewer SHMs (42.3 ± 8.7%; 5.2 nucleotides) compared with adults (69.7 ± 9.7%; 16.3 nucleotides) (Fig. 1i,j and Extended Data Fig. 3e,f). Two to three exposures to influenza viruses in children were previously shown to result in SHM rates similar to those of adults32, confirming primary immune responses in this study. Overall, while some gene expression differences were noted, these data suggest that no fundamental differences in overall B cell phenotypes drive imprinting in children.
We next evaluated the consequences of consecutive first infections with both subtypes of seasonal influenza A viruses in young children. For this, LIBRA-seq probe scores were used to assess the specificity of affinity-matured HA-specific B cells (Fig. 2a). At acute timepoints, occurring within a few days of symptom onset after H1N1 virus infection, there was a clear bias towards H3 reactivity, with expansion of H3-reactive B cells in both the H3–H1 group of children (82%) and the H1 group adults (69%) (Fig. 2b). Although adults had unknown exposure histories, they may have had recent, more frequent or more robust past H3 exposures, as suggested by higher acute serum antibody titres to H3 (Fig. 1b). Four to eight weeks after infection (convalescence), H1-reactive B cells became predominant in both the H3–H1 group of children (70%, H1-specific plus H1/H3 cross-reactive) and the H1 group of adults (82%) (Fig. 2b,c). The H1–H3 group of children exhibited increased H3-reactive B cells (56%) at the acute timepoint, with further expansion by convalescence (64%) (Fig. 2b,c). The H3-specific cells from the H1–H3 group of children also had higher SHMs (7.1 nucleotides) compared with H1-specific cells from the H3–H1 group of children (5.5 nucleotides) (Fig. 2d). No acute H3 serum antibody was detected in the H1–H3 group of children, and no non-specific memory recruitment against H3 at the cellular level was detected in H1-only children (Figs. 1b and 2b), suggesting no unappreciated contribution of pre-existing memory to the earlier expansion and increased SHM levels observed for H3-specific B cells. Other possible explanations include that H3N2 virus infection delayed symptom onset, providing more time for expansion before presentation, or that responses to H3N2 were more rapid or driven by greater T cell help. Both the H3–H1 and H1–H3 groups of children had lower SHM accumulation to the current than to the previous infecting strains, supporting de novo rather than back-boosted responses (Fig. 2d). All adult B cells showed extensively mutated IgV genes, indicating repeated exposures to H1N1 and H3N2 viruses (Fig. 2d). In children infected solely with H1N1, all HA-specific B cells were H1-reactive, with few IgV SHMs (Fig. 2d). For the H3–H1 and H1–H3 groups of children, 4–6% of H1/H3 cross-reactive B cells became detectable at convalescence and showed IgV genes with higher SHMs (H3–H1, 14.5 nucleotides; H1–H3, 14 nucleotides) than those specific to the infecting subtypes (H3–H1, 5.5 nucleotides; H1–H3, 7.1 nucleotides), suggesting a back-boosted origin (Fig. 2b,d). Most (91–92%) recent GC emigrant B cells from children were specific to the current infecting subtypes (Fig. 2e and Extended Data Fig. 3g). In conclusion, sequential heterosubtypic primary infections in children trigger strong de novo responses, with 5% of the memory B cells cross-reacting to both imprinting and infecting strains.
a, The predicted antigen specificity (probe scores coloured by subtype reactivity) of convalescent HA-specific B cells in the adult H1 and children H3–H1 groups. b, The percentages of H1-reactive (blue), H3-reactive (red) and H1/H3-cross-reactive (CR; purple) B cells in each group at the acute and convalescent timepoints. c, Data at the convalescent timepoint in b shown by individual. Only participants with more than ten cells are shown. n = 12 (adult H1), n = 12 (children H3–H1) and n = 4 (children H1–H3). Mean is shown as a straight line. Statistical analysis was performed using two-sided Wilcoxon matched-pairs signed-rank tests. d, Heavy-chain SHMs of HA-specific B cells at the convalescent timepoint in b. n = 344 H1-reactive cells (children H1 only), n = 334 H1-reactive cells (children H3–H1), n = 219 H3 reactive cells (children H1–H3). Mean is shown as a straight line. Statistical analysis was performed using two-sided unpaired Mann–Whitney U-tests. e, UMAP projections highlighting recent GC emigrants in each group coloured by subtype reactivity; the percentages are shown in pie charts. NS, not significant.
To further assess de novo responses in children, we next compared epitope and repertoire features of H1-specific B cells between groups, focusing on cells from the H1 group adults and the H3–H1 group of children. Cells that bound to both whole H1 and cH8/1 probes were identified as stalk-binding. Most H1-specific B cells from the H1-only and H3–H1 groups of children were head binding (H1-only, 65.9 ± 12%; H3–H1, 60 ± 10.1%), indicating immunodominance of the head domain during primary responses (Fig. 3a). Yet, the head/stalk ratios were highly variable in the H1 group of adults and the H1–H3 group of children. IgV gene SHM levels of H1-specific B cells were similar for the H1-only and H3–H1 groups of children, but were overall less mutated in children than in adults (Fig. 3b). On the basis of known stereotypical repertoire features and cH8/1 binding, we predicted the frequencies of H1-specific B cells targeting common epitopes, including central stalk (VH1-69/1-18/6-1)33, anchor (VH3-23/3-30/3-48+NWP motif)34 and trimer interface (VK1-39+Y49&Q55)35,36 epitopes (Fig. 3c). Despite an enrichment of stereotypical central stalk-binding cells in adults (H1 group of adults, 18.4 ± 12.8%; H3–H1 group of children, 6.7 ± 4.5%), the overall distribution of epitope targeting was comparable across all groups (Fig. 3d). Out of the 18 monoclonal antibodies from pre-existing H3-specific memory B cells in the H3–H1 group of children, 61% (11 out of 18) were cross-neutralizing against multiple H3N2 strains and 67% (12 out of 18) were haemagglutination inhibition (HAI) positive, consistent with HA head immunodominance (Fig. 3e).
a, The proportions of all H1-specific B cells (H1 binders) in each group targeting head versus stalk. n = 12 (adult H1), n = 7 (children H1 only), n = 11 (children H3–H1) and n = 6 (children H1–H3). Mean is shown as a straight line. Statistical analysis was performed using two-sided Wilcoxon matched-pairs signed-rank tests. b, Heavy-chain SHMs of H1 binders in a. n = 154 H1 head binders and n = 103 H1 stalk binders (adult H1); n = 185 H1 head binders and n = 126 H1 stalk binders (children H3–H1). Mean is shown as a straight line. Statistical analysis was performed using two-sided unpaired Mann–Whitney U-tests. c, Surface footprints and repertoire features for the indicated epitopes shown in Cal09 H1 HA (PDB: 4JTV). d, The percentages of H1 binders targeting each epitope in individual participants of each group. The box and whisker plots show the first quartile (lower bound of the box), mean (centre line) and third quartile (upper bound of the box), and the whiskers extend to the minimum/maximum values (within 1.5× of the interquartile range). n = 12 (adult H1) and n = 12 (children H3–H1). Statistical analysis was performed using two-sided unpaired Mann–Whitney U-tests. Adjusted P values are shown for multiple comparisons. e, ELISA AUC, HAI titre and microneutralization half-maximum inhibitory concentration (IC50) of H3-specific monoclonal antibodies in the H3–H1 group of children against the indicated HAs and viruses. HC, heavy chain. f, HAI titre, ELISA AUC and half-maximum focus reduction neutralization (FRNT50) of head and stalk monoclonal antibodies from subsets of H1 binders in the adult H1 and children H3–H1 groups against the indicated HAs and viruses. The results in e and f represent the average of two technical replicates from one of the two independent experiments.
a, ELISA AUC, FRNT50, BLI equilibrium dissociation constant (Kd) of Fabs and the germline specificity of H1/H3 cross-group monoclonal antibodies against indicated HAs and viruses. Squares filled with an X indicate untested Fabs or monoclonal antibodies. b, VH and VK/L pairing of H1/H3 cross-group monoclonal antibodies from the indicated groups. c, The Kd of Fabs in a against Mich15 H1 and HK14 H3; affinity bias is indicated by colour. Mean is shown as a straight line. All values higher than 1,000 nM are categorized as negative and replaced by 2,000 nM. n = 14 (adult H1), n = 15 (children H3–H1) and n = 10 (children H1–H3) monoclonal antibodies. Statistical analysis was performed using two-sided Wilcoxon matched-pairs signed-rank tests. d, The neutralization potency (IC50) of monoclonal antibodies in a against the indicated viruses. All values higher than 100 μg ml−1 are categorized as negative and replaced by 250 μg ml−1. Monoclonal antibodies tested negative to all viruses are excluded. The box and whisker plots show the first quartile (lower bound of the box), mean (centre line) and third quartile (upper bound of the box), and the whiskers extend to the minimum/maximum values (within 1.5× of the interquartile range). n = 14 (adult H1), n = 15 (children H3–H1) and n = 10 (children H1–H3) monoclonal antibodies. Statistical analysis was performed using two-sided unpaired Mann–Whitney U-tests. Adjusted P values are shown for multiple comparisons. e, Weight loss (top) and survival (bottom) of mice that were prophylactically administered (intraperitoneal; 2 h before infections with 5 half-maximum lethal dose (LD50) of the indicated viruses) a cocktail of H1/H3 cross-reactive monoclonal antibodies (n = 10, 1 mg per kg) from the H3–H1 or H1–H3 group of children. n = 5 mice for each group. For weight loss, data are mean ± s.d. Statistical analysis was performed using the log-rank (Mantel–Cox) test. f, Competition ELISA between H1/H3 cross-group monoclonal antibodies from children in the H3–H1 group with two central stalk monoclonal antibodies (CR9114 and NI04359_d30_175) and a published monoclonal antibody (222_1C06) that targets a highly conserved, membrane-proximal epitope (anchor) on HA stalk. The results in a, c, d and f represent the average of two technical replicates from one out of the two independent experiments.
Imprinted antibodies are often predicted to have higher affinity to the imprinting strain than the infecting strain. Thus, Fabs were generated from all broadly neutralizing antibodies for binding kinetics and affinity measurements against Mich15 H1 and A/Hong Kong/4801/2014 (HK14) H3 using biolayer interferometry (BLI). Nearly all Fabs (13 out of 15) from the H3–H1 group of children showed higher affinity to HK14 H3 (H3, 0.023 ± 0.055 μM; H1, 0.8 ± 0.89 μM; H3 biased), whereas all Fabs from the H1–H3 group of children showed higher affinity to Mich15 H1 (H1, 0.0048 ± 0.0063 μM; H3, 1.3 ± 0.91 μM; H1 biased) (Fig. 4a,c). Fabs from the H1 group of adults showed equal proportions of H3 or H1 bias, probably reflecting a complex immune history with influenza over a lifetime (Fig. 4a,c). To verify the inducing strains of these B cells expressing broadly neutralizing antibodies, we expressed germline-reverted broadly neutralizing antibodies with predicted germline V(D)J sequences before the SHM-driven adaptation and tested their binding to H1, H2 and H3 HAs from strains near the birth years of the adults and children (Supplementary Table 3). The highest affinity of most of the predicted germline broadly neutralizing antibodies was to the imprinting rather than the infecting strains, verifying the imprinted origins (Fig. 4a). While most germline broadly neutralizing antibodies from adults and children in the H1–H3 group were specific to the imprinting strains, over half of those from the H3–H1 group of children were H1/H3 cross-reactive to some degree (Fig. 4a). This observation suggests that the H1-imprinted B cells targeting the central stalk mainly developed cross-binding to H3 through affinity maturation, whereas H3-imprinted B cells tend to be more predisposed to cross-group binding at the germline level. Notably, a third of the germline broadly neutralizing antibodies from adults were specific to A/Singapore/1/1957 H2, suggesting that these clones were originally induced against H2N2 strains (in 1957–1968) and subsequently adapted to H1N1 or H3N2 strains (Fig. 4a).
The presence of H3-imprinted broadly neutralizing antibodies in serum might also affect subsequent immunity to the H1 stalk through steric hindrance or reduced antigen availability. Notably, all H3-imprinted broadly neutralizing antibodies could readily inhibit H1 binding by either the high-affinity prototypical anti-stalk monoclonal antibody CR91148 or by NI04359_d30_175, an H1-specific VH1–69 class stalk monoclonal antibody from the H3–H1 group of children, suggesting a potential impediment to de novo H1 stalk responses (Fig. 4f).
In summary, we conclude that heterosubtypic imprinting occurs in an epitope-specific manner and can cause considerable functional and reactivity shifts in most antibodies that cross-react with the contemporaneous and imprinting strains.
To elucidate the molecular mechanisms causing altered reactivity to the stalk epitope driven by H3-imprinting, we determined the cryo-electron microscopy (cryo-EM) structures of two cross-group broadly neutralizing antibodies from the H3–H1 group of children in a complex with HK14 H3 and Mich15 H1 at overall resolutions ranging from 2.62 to 3.12 Å (Extended Data Fig. 7a–d and Supplementary Table 4). Both broadly neutralizing antibodies targeted the conserved central stalk region of HA (Fig. 5a,b), but approached HK14 H3 and Mich15 H1 with slightly different angular orientations, accommodating the surrounding N-linked glycans on each HA (Fig. 5c,d). Consistent with their higher affinities to HK14 H3 than to Mich15 H1 measured by BLI and ELISA (Fig. 4a,c and Supplementary Table 5), both broadly neutralizing antibodies exhibited a larger buried surface area on HK14 H3 and accordingly showed more extensive interactions with the major epitope region on helix A of HA2 in the HK14 H3 complex (Fig. 5e–h and Supplementary Tables 6 and 7). For both broadly neutralizing antibodies, there was an overall better fit to the stalk epitopes on H3 from the imprinting strain relative to H1 from the infecting strain, partially accounting for the H3-imprinting effects in a precursor–product manner.
a,b, Cryo-EM maps and atomic models of d30_103 (a) and d30_240 (b) in a complex with HK14 H3 and Mich15 H1 HAs. c,d, Top-down cross-sectional views of the d30_103 (c) and d30_240 (d) complexes. The Fv domains adopt different orientations due to Asn38 and Asn33 glycans near the epitopes on HK14 H3 and Mich15 H1, respectively. The black lines connect conserved Cys residues of the heavy and light chains to visualize Fv angles and relative orientation. e,f, Epitopes of d30_103 (e) and d30_240 (f) mapped onto the HA surface; involved CDR and FR loops are indicated. BSA, buried surface area. g,h, Detailed interactions of d30_103 (g) and d30_240 (h) around HA2 helix A. The dashed lines indicate hydrogen bonds and salt bridges. The interacting residues of each antibody are numbered according to the Kabat numbering scheme. i,j, Epitope conservation of d30_103 and d30_240 based on human seasonal H3N2 (1968–2024; i) and H1N1 (1977–2024; j) HA sequences. Epitope residues involved in hydrogen bond or salt-bridge interactions are indicated. k, The natural occurrence frequencies of amino acid variants at position 46 of HA2 in H1 (1918–1957; 1977–2024) and H3 (1968–2024) by year. l, The Kd of 15 neutralizing cross-group monoclonal antibodies (IgGs) from the H3–H1 group of children against NC99 H1 wild type (WT) and NC99 H1 N46D mutant HAs. m, Summary data of l; increase or decrease in apparent affinity is indicated by colour. All values higher than 10,000 nM were categorized as negative and replaced by 20,000 nM. Mean is shown as a straight line. The results in l and m represent the average of two technical replicates from one out of the two independent experiments for n = 15 monoclonal antibodies. Statistical analysis was performed using two-sided Wilcoxon matched-pairs signed-rank tests. n,o, Interaction networks and contact probabilities between paratope residues of d30_103 (n) and d30_240 (o) and HA2 residue 46 from molecular dynamics (MD) simulations of the Mich15 H1 (Asp46) complex and the NC99 H1 (Asn46) model structure. p,q, Contact frequencies (p) and electrostatic interaction energies (q) from MD simulations.
Collectively, these results show that an Asp46 residue in the HA stalk epitopes of imprinting H3N2 strains and later-infecting H1N1 strains was key to the selection. Recall of most cross-reactive memory B cells in the H3–H1 group of children resulted in a major loss of breadth to H1 strains with Asn46.
It remains unclear whether simultaneous exposure to H1 and H3 through vaccination could also alter the binding of cross-group B cells. To evaluate this, we obtained convalescent (day 30) blood from ten infants aged under 1 year who received their first dose of influenza vaccine during the 2018–2019 or 2019–2020 seasons. These vaccine strains share the same stalk epitopes as the H1 and H3 strains in our infection cohorts. B cell reactivity was determined using LIBRA-seq with HAs from historic, current and vaccine strains, plus cH8/1 and cH4/3 chimeric HAs (Extended Data Fig. 9a,b). Given the limited blood sampling available for infants, we obtained only 142 affinity-matured HA-specific B cells. After vaccination, as in the primary response elicited by infection in children, distinct IgV gene repertoire features and lower levels of class-switching and SHMs (50%; 5.7 nucleotides) were observed in B cells from infants compared with from adults (Extended Data Fig. 9d–i). The infants mounted a fairly balanced response to H1 (51%) and H3 (44%), along with a similar H1/H3 cross-reactive response (5%) (Extended Data Fig. 9b). Notably, all four H1/H3 cross-reactive B cells with high probe scores to cH8/1 (anti-stalk) were also positive to the NC99 H1 probe, suggesting that reactivity shifts against central stalk epitopes require separate, consecutive exposures to H3 and then H1 (Extended Data Fig. 9b,c). Together, these results suggest that heterosubtypic imprinting to the HA stalk could be avoided by simultaneous first exposures to H1 and H3 through vaccination in infancy.
Here we investigated the origins of immune imprinting by examining B cell responses to sequential first exposures to antigenically divergent influenza virus strains in young children. Beyond being primary responses with subtle variations in gene expression patterns, no major differences were noted in B cells at the level of transcriptome clustering that predisposed children to imprinting. Future analyses of larger datasets may resolve rare transcriptional clusters and the evaluation of cell-surface protein markers not evident by transcriptional analysis alone may be informative. Compared with the primary responses of children, adult B cells showed substantially more backboosting and a stereotyped IgV gene repertoire with more SHMs, suggesting substantial imprinting. Subtype specificities of predicted germline broadly neutralizing antibodies corroborated excessive imprinting of the adult repertoires, showing varied origins of birth-year strains, including a third to H2, which has not circulated since 1968. These distinctions suggest that widespread homosubtypic and heterosubtypic imprinting impact the B cell responses to influenza viruses in adults.
Sequential heterosubtypic infections in children led to targeting of the highly conserved HA central stalk epitope by cross-group MBCs. Affinity bias and germline targeting of the first infecting strains, with accumulating SHMs, corroborated this finding. These imprinted B cells exhibited deleterious shifts in reactivity and breadth, with reduced affinity and neutralization potency. Structural analyses showed that a single amino acid (HA2 Asp46) was the primary contact residue mediating binding to the H3-imprinting strain and to subsequent infecting H1 strains. Most pre-pdm H1N1 strains have Asn46 rather than Asp, differing by a single atomic group, which promoted a nearly universal shift in the functions of B cell memory to the important HA stalk epitope. In contrast to most B cells targeting the H1 stalk, these H3-imprinted B cells have a major gap in coverage to most pre-pdm H1N1 strains and show reduced activity against pdm-H1N1 strains. Cross-group anti-stalk antibodies from adults were unimpaired, including those from similar public anti-stalk classes (that is, VH1-18 encoded). This suggests that, with additional or repeated exposures to H1 strains, H3-imprinted B cells may be outcompeted or adapt through accumulating somatic mutations to acquire broader reactivity. Importantly, the reactivity of cross-group anti-stalk B cells appeared unimpaired after primary vaccination with both H1 and H3 strains simultaneously. However, a previous study showed that influenza infection had a greater impact on establishing the memory B cell repertoire than vaccination32, warranting further study.
As the imprinting-mediated reactivity shift was observed in most cross-group anti-stalk antibodies isolated from seven children, we conclude that even minor differences in the molecular structures of antigens encountered can substantially affect memory recall responses to particular epitopes. Thus, with a widespread focus on targeting only a few broadly conserved epitopes in the influenza vaccine field, such effects at each individual epitope level are of central concern.
Serum and peripheral blood mononuclear cell (PBMC) samples were obtained from participants enrolled in two prospective community-based studies in Nicaragua: The Household Influenza Transmission Study (HITS) and the Nicaraguan Pediatric Influenza Cohort Study (NPICS). HITS is an intensive transmission study that enrols households after identification of a laboratory-confirmed influenza case and conducts intensive follow-up of household members. NPICS is an ongoing, longitudinal cohort of children aged 0–14 years, established to study the development of immunity to influenza from birth through annual serosurveys and active surveillance for acute respiratory illness. The sample sizes were not predetermined by statistical methods. These are observational studies, so no blinding or randomization was used.
PBMCs were isolated from venous blood by density-gradient centrifugation and cryopreserved for subsequent cellular immunology assays, as previously described41. NPICS samples were collected during the 2017–2018, 2018–2019, 2019–2020 and 2022–2023 seasons, whereas HITS samples were collected during the 2015–2016 season in Nicaragua, which typically spans June to December each year. These samples represent both the pre-infection (0–3 days between symptom onset) and post-infection (4–8 weeks after symptom onset) timepoints, enabling characterization of immune responses across the course of infection in a well-defined community setting. Written informed consent was obtained from parents or legal guardians of all participants, with assent from children as appropriate. Both studies received ethical approval from institutional review boards in Nicaragua and at the University of Michigan (HUM00091392 and HUM00088895).
Healthy infants for analysis of immune responses to primary influenza vaccination were recruited at paediatric primary clinics at Nationwide Children’s Hospital (NCH), Columbus, Ohio. Sera and PBMCs were collected after 1 month of vaccination as described above. The sample sizes were not predetermined by statistical methods, and no blinding or randomization was used. Written informed consent was obtained from parents or guardians before any of the study procedures. The study was approved by the NCH IRB (18-00591).
Madin–Darby canine kidney (MDCK) cells were purchased from ATCC and maintained in culture at 37 °C with 5% CO2 in Dulbecco’s modified Eagle’s medium (DMEM, Gibco) supplemented with 10% FBS (Gibco), 1% l-glutamine (Gibco) and 1% penicillin–streptomycin (final concentration, 100 units ml−1 penicillin, 100 μg ml−1 streptomycin, Gibco). Humanized MDCK (hCK) cells42 (in-house cell line generated by the Kawaoka laboratory) were maintained in culture at 37 °C with 5% CO2 in minimum essential medium (MEM, Gibco) containing 5% (v/v) newborn calf serum (Sigma-Aldrich), 0.225% sodium bicarbonate (Corning), 1× amino acids (Gibco), 1× vitamins (Gibco), 1× anti-anti (Gibco), 4 mM l-glutamine (Gibco), 2 μg ml−1 puromycin (InvivoGen) and 10 μg ml−1 blasticidin (InvivoGen). Expi293F suspension cells were purchased from Thermo Fisher Scientific and maintained in culture at 37 °C with 8% CO2 in Expi293F Expression Medium (Gibco) with shaking at 125 rpm. Cell lines were not authenticated or tested for mycoplasma at the lab level. Influenza viruses were grown in-house in MDCK cells or specific-pathogen free (SPF) eggs, collected, purified and titred (Supplementary Table 9).
HA ectodomain sequences were synthesized by Integrated DNA Technologies (IDT) and cloned into a mammalian protein expression vector with a C-terminal foldon trimerization domain followed by AviTag and 6×His tag. Constructs were transfected using the ExpiFectamine 293 kit (Gibco) according to the manufacturer’s protocol. Supernatants were collected on day 5 after transfection and incubated with Ni2+-nitrilotriacetic acid (Ni-NTA) agarose (Qiagen). Agarose was then loaded onto a polypropylene gravity flow column (Thermo Fisher Scientific), washed with 20 mM imidazole in PBS and eluted with a solution of 500 mM imidazole, 20 mM Tris and 150 mM NaCl at pH 7.4. The eluate was buffer exchanged with PBS using a 100 kDa Amicon centrifugal column (Millipore). Purified HA proteins were stored at −80 °C (Supplementary Table 8).
For probes used in cell sorting, a Y98F mutation was introduced into all HA constructs, and constructs of the SARS-CoV-2 WT (D614G) receptor-binding domain (RBD) and chimeric HAs were generated as previously described43,44. All probes were synthesized, cloned, expressed and purified as described above. The purified probes were biotinylated (AviTag-specific) with BirA enzyme according to the manufacture’s protocol (Avidity). The unreacted biotin was removed by passage through a 7 kDa molecular mass cut-off desalting column (Zeba spin, Thermo Fisher Scientific). Biotinylated HAs were conjugated to TotalSeq-C PE streptavidin (PE-SA, BioLegend) and BV421 streptavidin (BV421-SA, BioLegend), whereas SARS-CoV-2 WT RBD was conjugated to APC streptavidin (APC-SA, BioLegend). Chimeric HAs (cH8/1 or cH4/3) and an empty control (no antigen, PBS only) were conjugated to TotalSeq-C non-fluorescent streptavidin (NF-SA, BioLegend). The amount of antigen needed for conjugation was calculated based on a 4:1 molar ratio of antigen to a fixed amount of 0.5 μg PE-SA, BV421-SA, APC-SA or NF-SA. Antigens were diluted in PBS to a final volume of 10 μl and SAs were added gradually to antigens five times on ice, 1 μl SA (0.1 mg ml−1 stock) every 10 min for a total of 5 μl (0.5 μg). The reaction was quenched with 5 μl 4 mM Pierce Biotin (Thermo Fisher Scientific) for 30 min for a total volume of 20 μl. Probes used for each sorting experiment were prepared on the same day.
Cell sorting for 10x Genomics single-cell sequencing
PBMCs were thawed and 0.5 million cells from each individual were aliquoted. The remaining PBMCs from each participant were pooled together for B cell enrichment using EasySep pan B cell magnetic enrichment kit (StemCell Technologies). Enriched B cells were stained with CD19 PE-Cy7 (BD Biosciences), TotalSeq-C CD79b (BioLegend) and antigen probes (HA-PE-SA, HA-BV421-SA, RBD-APC-SA, chimeric HA/empty-NF-SA) at 1:100 dilution in fluorescence-activated cell sorting (FACS) buffer (PBS supplemented with 2% FBS and 2 mM Pierce Biotin) on ice for 30 min. B cells were washed twice with FACS buffer and stained with 7-AAD viability staining solution (BioLegend). Populations that were 7-AAD−CD19+APC−PE+BV421+ were sorted as HA-specific B cells on the BD FACSMelody cell sorter (BD Biosciences). An aliquot of 0.5 million PBMCs from each individual was stained with CD19 PE-Cy7, CD4 BB515 (BD Biosciences) and a unique TotalSeq-C anti-human hashtag (BioLegend) at 1:100 dilution in FACS buffer on ice for 30 min. Aliquots were washed twice with FACS buffer and subsequently pooled together before staining with 7-AAD. Populations that were 7-AAD−CD19+ were sorted as CD19+ B cells. To account for low cell numbers, several thousands of CD4+ T cells from pooled PBMCs were sorted and mixed into HA-specific B cells as carrier cells. PBMCs from acute or convalescent timepoints were processed and sorted separately.
Sorted cells were immediately loaded onto the 10x Chromium X Controller to generate single-cell gel-beads in emulsion (GEM) using Chromium Next GEM Single Cell 5′ HT Reagent kits v2 (10X Genomics). 10x single-cell libraries of 5′ Gene Expression, V(D)J BCR and feature barcode (cell surface protein) were prepared according to the manufacturer’s user guide (CG000424 Rev B). Libraries were pooled and sequenced using NextSeq 1000/2000 P2 XLEAP-SBS Reagent Kit (300 cycles) on the NextSeq 1000 platform (Illumina) with the configuration of 26 cycles for read 1, 10 cycles for i7/i5 index and 150 cycles for read 2.
Computational analysis for single-cell sequencing data
Libraries of 5′ gene expression, V(D)J BCR and feature barcodes were demultiplexed using the cellranger mkfastq pipeline. FASTQ reads were mapped to the human genome (GRCh38-2020-A) either using a combination of cellranger_count and cellranger_vdj, or cellranger_multi (v.7.0.1 or newer). Downstream analyses were performed in R v.4.2.2 using Seurat (v.4.3.0 or newer), including quality control, data normalization, data scaling, dimension reduction (both linear and nonlinear), clustering, differential expression analysis, batch-effect correction, data visualization, and UMAP generation. Quality-control thresholds for each dataset were determined based on the distributions of detectable gene numbers (remove outliers with 3,000–5,000 based on dataset) and the percentage of mitochondrial genes (remove outliers with >5–10% based on the dataset). The donor identity of each cell was determined using an in-house hybrid demultiplexing approach that integrated results of cell hashing (hashtag) and a single-nucleotide-polymorphisms-based demultiplexing method (Souporcell) as previously described45. The following cells were filtered out: cells classified as doublets or unassigned based on hybrid demultiplexing; outliers in the distribution of detectable gene numbers or percentage of mitochondrial genes; and cells not expressing CD79A or expressing any of the non-B cell markers (LYZ, CD14, CD8A, GNLY, PPBP, CD3E, FCER1A, FCGR3A). Transcriptome data were normalized using a log-transform function with a scaling factor of 10,000, whereas cell surface protein data (TotalSeq antibody and antigen probe) were normalized using centred log-ratio normalization. Batch-effect correction analysis was performed using an Anchor method implemented in Seurat. After integration, we performed data scaling and linear dimension reduction using variable genes in principal component analysis and the top 15 principal components. High-quality cells were then clustered using the Louvain algorithm implemented in Seurat under a resolution of 0.6. Cells were clustered using the FindNeighbors and FindClusters functions. Further dimension reduction and visualization were performed using the RunUMAP function. DEGs for each cell cluster were identified using a Wilcoxon rank-sum test implemented in Seurat. B cell subset identity was assigned to each cluster based on DEGs and expression of stereotypical gene markers. We performed GSEA with DEGs from a putative recent GC emigrant cluster using the fgsea package v.1.24.0. Published gene sets were used for GSEA and relevant biological processes with adjusted P 2 were plotted (Extended Data Fig. 3h).
Full-length V(D)J contigs were assembled with cellranger_vdj or cellranger_multi (v.7.0.1 or newer) and aligned to IMGT reference using IgBLAST v.1.20.0. The downstream analyses and annotations were done using an in-house single-cell multi-model analysis software VGenes (https://wilsonimmunologylab.github.io/VGenes/). Cells with ‘good BCR’ were filtered using the following criteria: cells passed the transcriptome quality control, V(D)J information is available for one heavy chain paired with one light chain, classified as full-length and productive by VGenes. Chord plots for B cell repertoires were generated in R using chordDiagram function of circlize package v.0.4.16.
Antigen specificity prediction through probe score
Unnormalized UMI counts were extracted from the Seurat ADT assay for cells with ‘good BCR’. A probe score for each antigen was calculated as the UMI ratio of antigen to CD79b and an empirical cut-off of 0.1 was set to distinguish positive from negative. UMI ratios shown in probe score heat maps were log2-transformed for better visualization. To account for the dilution effect in UMI per antigen for cells reactive to multiple antigens, cells were considered to be positive for a given subtype (H1 or H3) when the sums of probe scores of all HAs from the same subtype were higher than 0.1. Subtype reactivity of each cell was determined based on the following criteria: (1) cells positive for H1 were identified as H1 reactive; (2) cells positive for H3 were identified as H3 reactive; (3) cells with UMI > 0 for at least two antigens from each subtype and positive for both H1 and H3 were identified as H1/H3 cross-reactive; (4) cells positive for the empty probe (no antigen) were identified as polyreactive; (5) cells positive for neither H1 or H3 were identified as non-reactive. Cells belonging to the polyreactive, or nonreactive category, were considered non-specific and removed from the dataset of HA-specific B cells. Within H1-reactive cells, stalk binders were identified when scores of chimeric H1 (cH8/1) were higher than the mean scores plus 3 s.d. of all H1 probes, while head binders were identified otherwise. The predicted antigen specificities of subsets of B cells were validated with corresponding monoclonal antibodies by ELISA.
High-protein-binding microtitre plates (Costar) were coated with recombinant HA antigens at 2 μg ml−1 in PBS overnight at 4 °C. The plates were washed three times with PBS containing 0.05% Tween-20 (PBS-T) and incubated with 200 μl blocking buffer (PBS containing 0.1% Tween-20 and 3% skimmed milk powder) for 1 h at room temperature. Serums were threefold serially diluted in dilution buffer (PBS containing 0.1% Tween-20 and 1% skimmed milk powder) starting at 1:100. Plates were incubated with 100 μl serum dilutions for 2 h at room temperature. Horseradish peroxidase (HRP)-conjugated goat anti-human IgG secondary antibody (Sigma-Aldrich) was diluted at 1:3,000 in dilution buffer. The plates were incubated with 100 μl secondary antibody dilutions for 1 h at room temperature. Plates were washed three times with PBS-T and developed with 100 μl SigmaFast o-phenylenediamine dihydrochloride solution (Sigma-Aldrich) for 10 min in the dark. An additional 50 μl 3 M hydrochloric acid was added to stop the development reaction. Absorbance was measured at 490 nm on a microplate spectrophotometer (Bio-Rad). The area under the curve (AUC) for each serum sample was calculated in GraphPad Prism 10. The limit of detection was calculated as mean absorbance plus 3 s.d. of serum at the acute timepoint from H1-only children who were previously naive to influenza. All AUCs below the limit of detection were replaced by a fixed value of 15.
Recombinant monoclonal antibody and Fab production
Subsets of HA-specific B cell clones with ‘good BCR’ from different cohort groups or timepoints were randomly selected for monoclonal antibody expression. Notably, all H1/H3 cross-reactive clones were selected to enrich sample size for memory recall response. The immunoglobulin heavy and light chain sequences of these clones were synthesized as gene fragments by IDT or Twist Bioscience. To generate germline version of monoclonal antibodies, the variable regions of each clone were aligned to IMGT reference using IgBLAST v.1.20.0 and somatic mutations in heavy and light chains were both reverted. Unmapped nucleotides in CDR3 junctions were replaced with sequences of affinity-matured antibodies. Synthesized gene fragments were cloned into human IgG1, human κ or human λ expression vectors. The heavy and light chain constructs of each monoclonal antibody were transiently co-transfected into Expi293F cells using polyethylenimine (Polyscience). The supernatants containing secreted monoclonal antibodies were collected on day 5 and purified using protein A-agarose beads (Thermo Fisher Scientific) as described previously46. To generate Fab, the heavy-chain fragments of selected monoclonal antibodies were inserted into a modified human IgG1 vector with Fc constant region replaced by 6×His tag. The Fab version heavy chain and corresponding light-chain constructs were co-transfected and secreted Fabs within supernatants were purified according to the same protocol for purifying recombinant antigen, as described above, except that the buffer exchange was done using a 10 kDa Amicon centrifugal column.
High-protein-binding microtitre plates were coated with recombinant monoclonal antibodies at 2 μg ml−1 in PBS overnight at 4 °C. Plates were washed three times with PBS-T and blocked with 150 μl PBS containing 20% FBS for 1 h at 37 °C. Antigen probes were generated as described before with unconjugated streptavidin (Invitrogen) and serially diluted 1:3 starting at 30 μg ml−1. The plates were incubated with 50 μl of probe dilutions for 1 h at 37 °C. HRP-conjugated rabbit anti-streptavidin polyclonal antibody was diluted 1:1,000 (Abcam) and 70 μl of antibody dilution was used to detect binding of probes. The plates were washed three times with PBS-T and subsequently developed with Super Aquablue substrate (eBiosciences). The absorbance was measured at 405 nm on a microplate spectrophotometer (Bio-Rad). Control antibodies with known binding characteristics were included on each plate and results were recorded when the absorbance of control reached 1.0 optical density (OD) units.
High-protein-binding microtitre plates were coated with 50 µl of A/Michigan/45/2015 HA at a concentration of 1 µg ml−1 and incubated overnight at 4 °C. Monoclonal antibodies with known epitope specificities were incubated at room temperature with EZ-Link Sulfo-NHS-Biotin (Thermo Fisher Scientific) for 4 h to be biotinylated and the unreacted biotin was removed by passage through a 7 kDa molecular mass cut-off desalting column (Zeba spin, Thermo Fisher Scientific). After blocking the plates with PBS containing 20% FBS for 1 h at 37 °C, 50 µl of each competing monoclonal antibody serially diluted at 1:2 ratio starting at 200 μg ml−1 was added in the coated wells for 2 h at room temperature. Then, 50 µl of each biotinylated monoclonal antibody was added at a concentration equal to twice its Kd and incubated in the wells with the competing monoclonal antibodies for 2 h at room temperature. After washing the plates three times with PBS-T, the wells were incubated with 100 µl of 1:1,000 diluted HRP-conjugated streptavidin (Southern Biotech) at 37 °C for 1 h. Super Aquablue ELISA substrate (eBiosciences) was then added, and the absorbance was measured at 405 nm on a microplate spectrophotometer (Bio-Rad). Biotinylated monoclonal antibodies were incubated in designated wells on each plate without any competing monoclonal antibody, and data were recorded when the absorbance of these wells reached an OD of 1–1.5 units. After subtracting the background, the percentage competition of each well was calculated by dividing the observed OD of that well by the OD reached by the positive control, subtracting this value from 1, and multiplying by 100.