
Brain cancers are the leading cause of cancer-related deaths in children and adolescents, surpassing leukaemia4. Deciphering the developmental correlates is pivotal to therapeutic advancement as malignant cells retain molecular and phenotypic properties of their progenitor origins5,6,7. Supratentorial ependymomas (ST-EPNs) are brain tumours that occur in the central nervous system, with varied outcomes and limited available therapies8,9,10. Recent genome-wide DNA methylation profiling studies have classified ST-EPNs into multiple subgroups with distinct fusion genes and patient outcomes2,3. These include the canonical ST-ZFTA subgroup, characterized by the fusion of NF-κB pathway regulator RELA with the zinc-finger-translocation-associated ZFTA (ZFTA-RELA), and the non-canonical ST-ZFTA subgroups (ZFTA clusters 1 to 4), which have ZFTA-RELA fusions or fusions between ZFTA and other partner genes. Furthermore, the ST-YAP1 subgroup is enriched for fusions of Hippo effector YAP1. It remains unclear whether these subgroups have distinct cellular origins and composition of malignant cell states, contributing to differences in outcomes and varying resistance to therapy. To address these questions, previous studies have used single-cell (scRNA-seq) and single-nucleus (snRNA-seq) RNA sequencing1,11 to characterize the molecular cell states of ST-EPN tumours based on distinct gene expression profiles. However, these studies did not include the non-canonical ST-ZFTA subgroups, which led to many cell states being sample- or subgroup-specific. These limitations highlight the need for a comprehensive study examining the composition of malignant cell states of tumours across all subgroups of ST-EPNs.
In addition to the cell-intrinsic properties, it has become clear how cancer cell diversity is further influenced by their microenvironment, where interactions with adjacent cells and non-genetic factors augment cellular variability and malignant phenotypes12. Recent advances in spatial transcriptomics have overcome the loss of spatial information in scRNA-seq analyses, thereby revealing the intricate ecosystem within various tumours13,14. Moreover, live-cell imaging has proven to be effective for capturing the dynamic nature of tumour cells within their microenvironment while preserving cell viability, morphology and function15. Such multilayered analyses linking cell state to microenvironmental influences, dynamic morphology and behaviour of malignant cells have yet to be carried out in ST-EPN tumours.
Here we integrate sc/snRNA-seq, spatial transcriptomics, and in vitro and in vivo live-cell imaging to provide a multidimensional framework to characterize tumour heterogeneity in ST-EPNs. Taken together, we identify the extensive tumour heterogeneity in ST-EPNs by shedding light on their developmental cell states, patterns of spatial localization, and cellular morphology and behaviour, thereby opening potential avenues for therapeutic interventions.
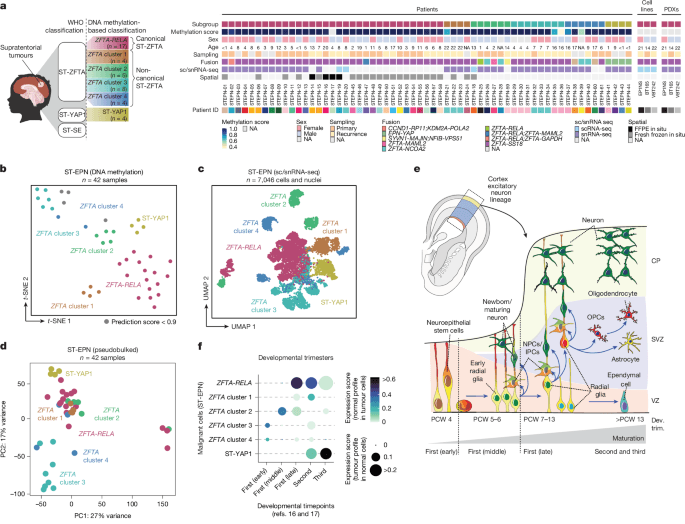
To comprehensively characterize the cellular tumour heterogeneity of ST-EPNs, we compiled a patient cohort of 42 patient tumour samples from 34 patients for single-cell transcriptomics, encompassing ZFTA-RELA (n = 17), ZFTA cluster 1 (n = 4), ZFTA cluster 2 (n = 5), ZFTA cluster 3 (n = 8), ZFTA cluster 4 (n = 4) and ST-YAP1 (n = 4) subgroups (Fig. 1a). We also included 56 ZFTA-RELA tumour samples from 23 patients for spatial transcriptomics analysis using 10x Xenium. We first confirmed subgroup classification by performing genome-wide DNA methylation profiling on all of the samples (Fig. 1b). ZFTA-RELA, ZFTA cluster 1 and ZFTA cluster 3 had canonical ZFTA-RELA fusions, ZFTA cluster 2 and ZFTA cluster 4 had non-canonical ZFTA fusion types, and ST-YAP1 had fusions of YAP1 (Fig. 1a,b and Supplementary Table 1). Orthotopic patient-derived xenografts (PDXs) (ZFTA-RELA PDX, n = 3) and patient-derived cell lines of the ZFTA-RELA subgroup (n = 3) were also included. We performed deep full-length single-cell transcriptomics on frozen (snRNA-seq) and fresh (scRNA-seq) tumour specimens, and retained a total of 7,840 high-quality cells, including a mix of malignant tumour cells and non-malignant cell types derived from the tumour microenvironment. To distinguish between malignant cells and non-malignant cell types, we used three complementary approaches: genome-wide copy-number alterations, similarity between the transcriptome of each single-cell and a reference collection of healthy brain cell types16,17 and expression of canonical cell type marker genes (Extended Data Fig. 1a–d). We retained 7,046 high-quality malignant cells (mean of 5,511 genes per cell or nucleus; Extended Data Fig. 1e and Supplementary Table 1), which we processed uniformly and co-embedded into a shared low-dimensional space.
a, Oncoplot depicting the ST-EPN samples profiled in this study. FFPE, formalin-fixed paraffin-embedded; NA, not applicable or information not available; WHO, World Health Organization. b, t-Distributed stochastic neighbour embedding (t-SNE) plot of the ST-EPN samples profiled for DNA methylation and coloured by molecular subgroup. Samples with a methylation prediction score <0.9 are indicated in grey. c, Uniform manifold approximation and projection (UMAP) plot of malignant ST-EPN cells profiled by sc/snRNA-seq and coloured by the molecular subgroup. d, Principal component (PC) analysis plot of 3,000 highly variable genes across samples; each dot is a sample coloured by molecular subgroup. e, Simplified schematic of cell types present during human cortical development16,17. CP, cortical plate; Dev. trim.; developmental trimester; IPCs, intermediate progenitor cells; NPCs, neural progenitor cells; OPCs, oligodendrocyte precursor cells; PCW, post-conception week; SVZ, subventricular zone; VZ, ventricular zone. Bottom, cell types (y axis) present during the first, second and third trimester of human cortical development (x axis). f, Projections of ST-EPN subgroups (y axis) onto developmental timepoints found across the developing human cortex (x axis). First (early), PCW 4; first (middle), PCW 5–6; first (late), PCW 7–13; second, PCW 14–27; third, PCW 28–37. The diagram in a was created using BioRender; Jeong, D. https://BioRender.com/mqaz6z0 (2026).
As DNA methylation profiles used to categorize these tumours cluster subgroups differently (Fig. 1b) and are considered epigenetic fingerprints of cellular origins in both development and tumorigenesis18,19, we hypothesized that ST-EPN tumours would correspondingly be transcriptionally distinct. Accordingly, we found that the malignant cells cluster both by sample and by molecular subgroup classification (Fig. 1c and Extended Data Fig. 1e), consistent with previous observations3. We further derived the top 3,000 highly variable genes across samples and performed principal component analysis to demonstrate that samples cluster by their molecular subgroup classification (Fig. 1d). We next examined whether the intertumoural differences observed across subgroups reflect different developmental origins and compared the transcriptomic profiles of malignant cells with normal tissues’ transcriptomes. We first assembled a single-cell reference atlas of the developing human cerebral cortex from two published scRNA-seq datasets16,17 (Fig. 1e and Extended Data Fig. 1f,g) that includes all three prenatal trimesters of human cortical development from post-conception week 4 to 37 (Supplementary Tables 2 and 3). We next projected gene expression profiles of non-malignant cells from the reference atlas16,17 onto individual ST-EPN cells (Fig. 1f and Extended Data Fig. 2a). While ZFTA cluster 3 and ZFTA cluster 4 tumours projected to the earliest time window of the early and middle first trimesters, ZFTA cluster 2 and ZFTA cluster 1 tumours mapped onto the later windows of middle first and second trimesters. Finally, canonical ZFTA-RELA tumours projected broadly from the late first to second and third trimester, while ST-YAP1 aligned with the latest timepoints (Fig. 1f and Extended Data Fig. 2a). Overall, the correlation of ST-EPN subgroups with different developmental stages suggests divergent developmental patterns across subgroups.
In summary, our analyses reveal that molecularly distinct ST-EPN subgroups are transcriptionally distinct and align to distinct developmental timepoints across human cortical development.
Cell states mirror early human cortex
To identify specific cell states across ST-EPN tumour subgroups, we next moved from pseudobulk projections to comparing single-cell gene expression profiles identified in each sample by non-negative matrix factorization (NMF)20. This analysis revealed eight clusters of recurrent programs across ST-EPN tumours (Fig. 2a), termed metaprograms, that reflect cellular states. We annotated each metaprogram based on the expression of known cell-type-specific marker genes (Supplementary Table 4), projection onto developing human cerebral cortex reference atlases (Extended Data Fig. 2b) and functional analysis using Gene Ontology (GO) enrichment analysis (Extended Data Fig. 2c and Supplementary Table 5).
a, The Pearson correlation coefficient between individual NMF programs identified within each ST-EPN sample profiled by snRNA-seq. Programs are grouped into eight recurrent metaprograms (dashed lines). MES, mesenchymal. b, The relative expression (z score) of the top 30 genes for each metaprogram across all ST-EPN cells profiled in this study. Selected genes are highlighted. c, UMAP plot of malignant ST-EPN cells coloured by identified cellular state. d, The proportion of cellular states (y axis) in each ST-EPN sample (x axis). Sample properties are displayed in the bottom row. e, Cell state plot of malignant ST-EPN cells. Cells were scored for the metaprograms identified by NMF analysis (top 30 genes) and coloured by molecular subgroup.
Two metaprograms were associated with generic cancer cell processes, including a cycling metaprogram (HELLS, CENPF)21,22 that is enriched in genes associated with cell proliferation, and a mesenchymal/hypoxia (PGK1, ENO1, CD44)23,24 metaprogram that highly expresses hypoxia-related genes (Fig. 2b and Supplementary Table 4). The remaining six metaprograms were distinctly related to developmental programs, including (1) an embryonic-like metaprogram (ALDH1A2, CTBP2, ACTN4), which expresses genes that are essential for the formation and patterning of the embryo23,25,26 and is enriched in GO terms related to retinoic acid receptor signalling, not matching to a particular cell type found in the developing human brain; (2) an neuroepithelial-like metaprogram (TUBA1A, ACTG1)27,28, which strongly projects to neuroepithelial stem cells of the developing human cortex; (3) a radial glial-like metaprogram that expresses radial glial genes (LRIG1, DCLK1)29,30; (4) an embryonic-neuronal-like metaprogram (RBFOX1, CNTNAP2) that is enriched with immature neuronal genes31,32; (5) a neuronal-like metaprogram (KIRREL3, NRXN3) that is enriched in neuronal-differentiation-related genes33,34; and (6) an ependymal-like metaprogram (DNAH9, DNAH6) that is enriched with cilia-related genes35 (Fig. 2b, Extended Data Fig. 2b,c and Supplementary Tables 4 and 5). These metaprograms partially correlated with those identified in posterior fossa, spinal and supratentorial ependymomas of previous studies14 (Extended Data Fig. 2d). We further examined the proliferative capacity of each metaprogram and found that the most progenitor-like populations, namely neuroepithelial-like and embryonic-like cells, were the most proliferative, whereas radial glial-like and ependymal-like were the least proliferative (Extended Data Fig. 2e,f). Identification of differentially expressed genes between the two progenitor-like populations revealed that, while neuroepithelial-like cells were enriched in genes associated with GO terms related to central nervous system development and neural differentiation (Extended Data Fig. 2g–i), embryonic-like cells were enriched in genes associated with early embryonic developmental processes, including somite development (Extended Data Fig. 2g–i).
We next examined how the proportion of the identified metaprograms differs across ST-EPN subgroup. While ZFTA-RELA tumours were composed predominantly of neuroepithelial-like, neuronal-like and ependymal-like cells, neuronal-like cells were few or absent in ZFTA cluster 1, ZFTA cluster 3 and ST-YAP1 tumours (Fig. 2d and Extended Data Fig. 3a). Conversely, ZFTA cluster 2, 3 and 4 tumours had a lower frequency of ependymal-like cells. Moreover, ZFTA cluster 3 tumours displayed a distinct intratumoural composition, being mostly composed of embryonic-like and embryonic-neuronal-like subpopulations (Fig. 2d and Extended Data Fig. 3a). This is consistent with the undifferentiated histology of ZFTA cluster 3 tumours, previously often diagnosed as sarcoma, central nervous system embryonal or other primitive tumours3.
To summarize the distribution of metaprograms in each ST-EPN subgroup, we scored all single cells for the two most proliferative and immature (neuroepithelial-like and embryonic-like) and the two more mature (neuronal-like and ependymal-like) lineage-related expression programs and visualized the results as a cell-state plot (Fig. 2e). We found that the two immature cell states existed in a mutually exclusive manner, indicating that, when neuroepithelial-like cells were present in ZFTA-RELA and ZFTA clusters 1, 2 and 4, there were no embryonic-like cells present. Conversely, in ZFTA cluster 3, in which embryonic-like cells were highly present, neuroepithelial-like cells were much less abundant. This probably indicates two distinct developmental signatures of ST-EPN tumours, with ZFTA cluster 3 especially as a distinct entity from the other subgroups. Notably, despite the different cellular state composition, both ZFTA-RELA and ZFTA cluster 3 have the same ZFTA-RELA fusions (Fig. 1a). Differential gene expression analysis between ZFTA-RELA and ZFTA cluster 3 (Extended Data Fig. 3b–d) identified early development and morphogenic-related gene signatures enriched in ZFTA cluster 3, consistent with the higher proportion of embryonic-like cells in these tumours.
Moreover, tumours from different subgroups were distinct in the lineages in which they represent. While there was a continuum of gene expression to both neuronal and ependymal-like cells in ZFTA-RELA tumours, the other ST-EPN subgroups showed unique cell state signatures, with ZFTA clusters 1–3 having only one mature cell state and ZFTA cluster 4 appearing to remain in a premature cell state (Fig. 2e). Moreover, ST-YAP1 tumours mainly exhibited ependymal-like signatures, with very few progenitor cells present. We validated these findings using an external patient cohort2 and confirmed that patient ST-YAP1 tumours map onto ependymal-like signatures, whereas patient ZFTA-RELA tumours map onto both neuronal-like and ependymal-like signatures (Extended Data Fig. 3e–g).
Overall, our findings suggest that ST-EPN tumours from different molecular subgroups have distinct developmental signatures, with variability in neuronal and ependymal lineages. We highlight ZFTA cluster 3 and ST-YAP1 especially as distinct entities in progenitor and lineage transcriptional profiles.
Spatial mapping of ZFTA-RELA cell states
We next investigated how these identified tumour cell states are spatially organized in the tissue, and whether recurrent spatial patterns of localization exist across tumours. To do so, we performed 10x Genomics Xenium in situ transcriptomics on a total of 56 tumour sections from 23 patients with ZFTA-RELA to enable subcellular-resolution mapping of 358 target genes (Supplementary Table 6). We focused on tumours of the canonical ZFTA-RELA subgroup as they encompass the majority of ST-EPNs2. We used a combination of a custom-based gene panel curated from our scRNA-seq dataset, containing marker genes of identified tumour subpopulations, and fusion-specific probes to detect ZFTA-RELA fusion type 1, 2 and 3 transcripts, combined with a human brain gene panel containing normal cell-type-specific genes (Fig. 3a).
a, Schematic of the 10x Xenium in situ workflow. b, Illustration of the metaprogram annotation (left) and calculation of the spatial coherence score (right) of a representative ZFTA-RELA sample (STEPN-19). Two regions within the sample with high and low spatial coherence scores are shown. c, The proportion of tumour cell states and non-malignant cell types (y axis) in patient ZFTA-RELA tumours profiled by 10x Xenium (x axis) (top). For patients with multiple tumour sections analysed, the average proportion is shown. Samples are ordered by increasing spatial coherence score. Bottom, spatial maps of two sections, demonstrating differences in spatial organization between disorganized (STEPN-54) and structured (STEPN-19) tumours. d, Correlation between the spatial coherence score and the logit-transformed proportion of mesenchymal/hypoxia cells (top) or embryonic-neuronal-like cells (bottom) in ZFTA-RELA tumour samples profiled by 10x Xenium. Datapoints (representing mean values across tumour sections per sample) are interpolated with simple linear regression. The goodness of fit (R, R2), Bonferroni-corrected P values and the total number of tumour samples (n) are displayed at the top. The grey-shaded band denotes the 95% confidence interval for the mean fitted response at each x value. The diagram in a was created using BioRender; Jeong, D. https://BioRender.com/72agz2l (2026).
We first annotated each cell in situ by assessing the similarities between the top markers of the spatially identified Louvain clusters and previously defined tumour cell states and/or non-malignant cell type marker genes, as well as by label projection from our patient tumour sc/snRNA-seq dataset (Extended Data Fig. 4a). We detected on average 105,643 cells per tumour section and identified 12 spatial cell types and states including 5 non-malignant cell types and 7 malignant cell states (Fig. 3b,c and Extended Data Figs. 4 and 5). Overall, the proportions of tumour cell states within samples were highly correlated with the proportions detected by sc/snRNA-seq (R = 0.77, P = 0.003, Extended Data Fig. 4b). Moreover, we identified neurons that were absent in the sc/snRNA-seq analysis of patient tumours (Figs. 1a–c and 3c). Finally, we confirmed cell identity through expression of canonical marker genes (Extended Data Fig. 4a) and malignant cell annotation based on higher expression of the fusion-specific ZFTA-RELA fusion probe (Extended Data Fig. 4c).
After annotating spatially distributed cell states, we observed that tumours segregated into two global organization patterns as also seen in glioblastoma14: (1) high compartmentalization of cell states, which we term structured tumours; and (2) cell states or types scattered throughout the section, which we term disorganized tumours (Fig. 3b,c). We quantified the degree of spatial organization of each tumour section by measuring the degree by which cells from the same state or type are surrounded by other cells of the same state or type, termed the spatial coherence score (Fig. 3b). Sections that appear structured will therefore have high spatial coherence scores; inversely, sections that appear disorganized will have low spatial coherence scores. By applying our algorithm to 56 tumour sections, we successfully distinguished between tumour sections that were structured (for example, STEPN-19), and those that were disorganized (for example, STEPN-54; Fig. 3c and Extended Data Fig. 4d). We did not observe a statistically significant difference in the global structural organization between primary and recurrent tumours (data not shown).
To determine whether the presence of a particular tumour state or type correlates with spatial organization, we performed linear regression analyses between the spatial coherence score of each sample and the proportion of cells observed for each malignant cell state or non-malignant cell type (Fig. 4e and Extended Data Fig. 4e). This analysis revealed that higher spatial coherence scores were positively correlated with the logit-transformed proportion of mesenchymal/hypoxia cells (R = 0.69, Bonferroni-corrected P = 0.00315, n = 23; Fig. 3d and Supplementary Table 7), while inversely correlated with the logit-transformed proportion of embryonic-neuronal-like cells (R = −0.59, Bonferroni-corrected P = 0.0338, n = 23; Fig. 3d and Supplementary Table 7). These findings were also corroborated by multiple linear regression analysis (Supplementary Table 7), suggesting that the presence of mesenchymal/hypoxia and embryonic-neuronal-like cell states is specifically associated with structured or disorganized tumours, respectively.
a, Schematic of the CellCharter workflow. b, Overlay of 10x Xenium metaprogram assignment, CellCharter spatial clusters and haematoxylin and eosin (H&E) staining for endothelial cells (circled) in ZFTA-RELA tumour section (STEPN-12), showing correspondence of the morphologically distinct local tumour region with metaprogram annotation and spatial cluster. c, The proportion of cell states or types (x axis) across 26 spatial clusters (y axis) (left). Spatial clusters are grouped by similarity in the cell state or type most dominantly present in each cluster. Right, representative spatial maps of myeloid-enhanced, mesenchymal/hypoxia-enhanced and endothelial-enhanced spatial clusters with their corresponding metaprogram annotations. d, Spatial clusters (rows) present across 56 tumour sections (columns). Rows are ordered by entropy of spatial cluster, with the top half annotated as sample-restricted (present in 1–2 samples) and the bottom half annotated as sample-shared (present in three or more samples). The top row is coloured by sample ID. The diagram in a was created using BioRender; Jeong, D. https://BioRender.com/mqaz6z0 (2026).
We next calculated the spatial coherence for each cell state or type to determine whether certain cell states or types are more likely to co-localize with themselves (Extended Data Fig. 4f). Mesenchymal/hypoxia cells showed high spatial coherence, suggesting that hypoxia correlates with global tumour spatial coherence, as well as co-localization of mesenchymal/hypoxia cells in distinct local neighbourhoods. The inverse was observed for embryonic-neuronal-like cells, suggesting that these cells are more likely to be scattered throughout the tissue.
Overall, our results suggest that ZFTA-RELA tumours have distinct global spatial organization patterns, with more organization being highly correlated with the presence of mesenchymal/hypoxia cells, and more disorganization being correlated with embryonic-neuronal-like cells.
Having analysed global spatial organization, we next sought to understand the proximal spatial relationships between all cell states and/or cell types by identifying groups of cells with similar neighbourhoods within tumours. We first identified local spatial patterns, or spatial niches, within a tumour tissue individually, by clustering cells based on the proportion of cell states or types in their spatial proximity (Extended Data Fig. 6a). This analysis showed demarcated regions that were both transcriptionally and morphologically distinct, including spatial niches containing ependymal rosettes composed of ependymal cells (Extended Data Fig. 6a), demonstrating the direct correlation between transcriptional cellular states and morphology. We next aimed to identify recurrent local spatial patterns across multiple tumour sections by correlating spatial niches on the basis of the proportion of cell states or types present in each section (Extended Data Fig. 6b). Overall, we identified six recurrent niches, each enhanced in distinct malignant cell states or non-malignant cells (Extended Data Fig. 6b). Furthermore, we applied an orthogonal algorithmic framework called CellCharter24 that simultaneously clusters local spatial patterns across all samples. In brief, the method combines all cells and their features from multiple samples to perform dimensionality reduction. Next, a network of cells is identified by their spatial proximity, after which clustering is performed using a Gaussian mixture model (GMM) (Fig. 4a). We determined n = 26 stable local spatial patterns, or spatial clusters, across 56 tumour sections (Extended Data Fig. 6c) and identified 26 clusters at varying proportions in each section (Extended Data Fig. 6d). Moreover, we found that spatial clusters demarcated morphologically distinct regions in the tumour tissue: for example, regions with a high proportion of endothelial cells (Fig. 4b).
We next subcategorized the 26 identified spatial clusters according to the cell state or type most abundantly represented within the cluster—a designation we refer to as enhanced. Several clusters contained a high proportion of non-malignant cell types, including myeloid-enhanced (clusters 4 and 14), myeloid- and endothelial-enhanced (cluster 6) and endothelial-enhanced (cluster 18) regions (Fig. 4c). Other clusters exhibited a high proportion of specific malignant cell states, including mesenchymal/hypoxia-enhanced (clusters 22 and 13), neuronal-like-enhanced (clusters 24, 19, 1, 17 and 21) and the remaining spatial clusters, which were neuroepithelial-like enhanced (Fig. 4c). Moreover, these analyses corroborate findings from an analysis of recurrent spatial patterns by cell state or type proportions (Extended Data Fig. 6b,e,f), in which myeloid and endothelial cells form distinct local spatial niches or clusters, and mesenchymal/hypoxia, neuronal-like and neuroepithelial-like cells preferentially form clusters with themselves (Fig. 4c and Extended Data Fig. 6b,e,f).
Furthermore, we distinguished spatial clusters that were either present in a small number of samples (sample-restricted) or shared across samples (sample-shared) (Fig. 4d). While spatial clusters with a high proportion of non-malignant tumour microenvironment-related cells were more likely to be present across samples (Extended Data Fig. 6g), spatial clusters prevalent in malignant cells were present both in specific samples and across samples. These findings further highlight the heterogeneity of tumours across samples in not only their cell state or type composition but also the spatial arrangement of cells.
Overall, we identified local spatial patterns of cell states across ZFTA-RELA tumours, with a common observation of mesenchymal/hypoxia, neuroepithelial-like and neuronal-like malignant cell states preferentially co-localizing with themselves. Furthermore, we identified local structures that are both shared and unique across samples, underscoring the heterogeneity of the spatial arrangement of malignant cells within tumours.
Having characterized the diversity of tumour cell states in patient tumours, we next considered how interactions with the tumour microenvironment—particularly neurons and glial cells—influence their morphology and functional behaviour.
To do so, we first compared the heterogeneity of ZFTA-RELA patient-derived models to identify the extent to which each model recapitulates cell states present in the patient tumours. We performed 10x scRNA-seq analysis of three patient-derived ZFTA-RELA cell models grown as adherent or spheroid monocultures, cocultured with rat E19 cortical cells or as PDXs, to characterize the transcriptional heterogeneity across various disease models (Extended Data Fig. 7a–d). We additionally characterized the rat E19 cortical cells used in cocultures as a mixture of neurons and glial cells (Extended Data Fig. 7e). ZFTA-RELA cells grown as a monoculture (adherent and spheroid) were prevalent in neuroepithelial-like cells (Extended Data Fig. 7b–d), whereas ZFTA-RELA cells grown in coculture exhibited a greater abundance of neuronal-like cells (Extended Data Fig. 7a–d) and neuronal-function-related GO terms (Extended Data Fig. 7f,g), as well as some early ependymal-like signatures (Extended Data Fig. 7b–d). Finally, out of all of the models, cells grown in PDXs most closely recapitulated the cell states in patients, with both neuronal-like and ependymal-like signatures (Extended Data Fig. 7b–d). These findings overall suggest that brain-resident cells are required for plasticity of progenitor-like to more mature cell states. Moreover, we identified PDX models and coculture systems with rat E19 cortical cells as models that most faithfully recapitulate tumour cell states.
Having observed distinct morphologies of cell states in these conditions, we assessed the morphological features of tumour cell states in coculture with rat E19 cortical cells and PDX models. In both models, we observed tumour cells exhibiting immature neuron-like membrane protrusions resembling tumour microtubes (TMs)15,36,37, which could be classified into four distinct morphological subtypes (Fig. 5a): cells without processes (0 TMs); cells with 1–3 short primary processes; cells with more than 3 short primary processes; and cells with 1–3 long primary processes (longer than 100 μm). We next examined whether tumour cell morphologies reflect their transcriptomic cell states. We therefore aimed at overlaying these morphologies with the molecular ZFTA-RELA cell state classification. To do so, we selected markers from our patient sc/snRNA-seq dataset (Supplementary Table 4 and Extended Data Fig. 8a) as well as known neurodevelopmental markers, and performed immunofluorescence staining together with high-resolution light microscopy (Fig. 5b and Extended Data Fig. 8b,c).
a, Morphological characterizationof ZFTA-RELA cells (EP1NS) in in vivo PDX (top row) and in vitro coculture (bottom row) models. ZFTA-RELA cells express endogenous tdTomato. Blood vessels are shown in green. Scale bars, 20 µm (top, left 3), 50 µm (top, far right), 25 µm (bottom, left 3), 100 µm (bottom, far right). b, Representative immunofluorescence images and the mean signal intensity of in vitro coculture models of ZFTA-RELA cells, categorized by morphological cell subtypes. Data are the mean intensity value of n = 155 cells acquired from n = 3 independent biological replicates per marker. Scale bars, 20 µm. c, Representative 10x Xenium images of each morphological cell subtype. Each dot represents detected transcripts from the custom (n = 100) and base panel (n = 255) used for patient tumour sections. The table shows the top two marker genes for each morphological cell subtype. Scale bars, 20 µm. d, The cell migration speed in the in vitro coculture model of ZFTA-RELA cells in µm h−1 (n = 235 cells acquired from n = 3 independent biological replicates). Data are mean ± s.e.m. with individual datapoints. P values were calculated using Dunn’s multiple-comparison test; not significant (NS), P = 0.286; **P = 0.0046, ***P = 0.00058, ****P < 0.0001. e, Representative neuronal-like ZFTA-RELA tumour cell showing saltatory migration in in vitro coculture. Scale bars, 50 µm. f, Quantification of migratory modes classified as neuroepithelial-like-2 (n = 28) or neuronal-like (n = 34). g, Neuronal-like migratory patterns of ZFTA-RELA cells in vitro. The arrows indicate the direction of TM movement. The arrowheads point to the branching point (branching migration), cell soma (locomotion) or stable TM tip (translocation). Scale bars, 100 µm (top), 50 µm (middle and bottom). h, In vivo (PDX) time-lapse imaging of TM dynamics of ZFTA-RELA cells. The arrowheads point to the ends of TMs. Blood vessels are shown in green. Scale bars, 20 µm. i, The percentage of dividing ZFTA-RELA tumour cells in coculture categorized by their morphological cell state (n = 83 neuroepithelial-like, n = 97 immature ependymal-like and n = 55 neuronal-like cells). The diagram in a was created using BioRender; Jeong, D. https://BioRender.com/7khydcm (2026).
We identified Nestin+S100B+ neuroepithelial-like cells with no or 1–3 short TMs; CCDC40+Nestin+S100B+ immature ependymal-like cells, classified as cells with more than 3 short TMs; and DCX+Nestin+S100B+ neuronal-like cells, classified as cells with 1–3 long TMs (Fig. 5b and Extended Data Fig. 8c). We confirmed our morphologies to cell state assignments by performing 10x Xenium analysis of ZFTA-RELA cells cocultured with rat E19 cortical cells to further identify the molecular features of each morphological subtype (Fig. 5c, Extended Data Fig. 9a and Supplementary Table 8). Using this approach, we subclassified neuroepithelial-like cells into two groups: cells lacking TMs (neuroepithelial-like-1) and cells with 1–3 short TMs (neuroepithelial-like-2). While both groups expressed cell cycling markers (neuroepithelial-like-1: ARL6IP1, CENPF; neuroepithelial-like-2: TUBA1A, PRDX1) (Fig. 5c and Supplementary Table 8), neuroepithelial-like-2 cells expressed additional development-associated markers such as NES and DCX (Fig. 5c and Extended Data Fig. 9a). Moreover, immature ependymal-like cells expressed progenitor markers including MAP3K19, which is also highly expressed by tumour ependymal-like cells (Extended Data Fig. 8a), and DNER. As these cells are positive for CCDC40, a motile cilia-function-related protein specifically expressed in ependymal-like cells (Extended Data Fig. 8a), we classified these cells as likely a more immature population of the ependymal-like cells found in patient tumours. This finding also corroborates scRNA-seq results of tumour cells in coculture, in which we found a low mature ependymal-like signature (Extended Data Fig. 7b–d). Finally, neuronal-like cells expressed immature neuronal markers including TUBB3 and DCX. Collectively, we overlayed molecularly defined ZFTA-RELA cellular states with distinct morphologies in both in vitro coculture models and in vivo.
We next investigated whether cellular states with distinct morphologies also have unique cellular behaviours. To this end, we characterized subcellular and cellular tumour cell behaviour using temporal live-cell imaging. Notably, both neuronal-like cells and neuroepithelial-like-2 cells were the most migratory cells, while neuroepithelial-like-1 and immature ependymal-like cells were the most stationary (Fig. 5d). Moreover, we noted distinct modes of migration across cell states, including a continuous migratory mode in which cells undergo a steady motion across time, and a saltatory migratory mode whereby cells move in intermittent bursts of a rapid, jumping motion. Note that, while neuroepithelial-like-2 cells more commonly used a continuous migratory mode, neuronal-like cells more frequently adopted saltatory migration patterns38 (Fig. 5e,f and Extended Data Fig. 9b,c). Notably, saltatory movement is commonly observed in migrating immature neurons during development39, indicating a shared phenotypic feature between tumour neuronal-like cells and immature neurons. We therefore characterized the invasion patterns of neuronal-like cells in closer detail and distinguished three modes of neural-like cell migration, consisting of branching migration, locomotion and translocation15 (Fig. 5g and Extended Data Fig. 9d). Moreover, we examined tumour TM dynamics in neuronal-like cells and observed behaviours reminiscent of neurites during neurodevelopment, including protrusion, retraction and branching40,41 (Fig. 5h and Extended Data Fig. 9e). Overall, neuronal-like cells exhibited the most net TM turnover, which includes both protrusion and retraction, out of all cell states in both in vitro coculture with rat E19 cortical cells and in vivo models (Extended Data Fig. 9f). In summary, we observed how neural and neurodevelopmental migratory mechanisms are leveraged by neuronal-like ZFTA-RELA cells to migrate through the neural microenvironment of the brain.
Furthermore, we measured whether different cellular states have different proliferation rates. Neuroepithelial-like-2 cells were the most proliferative compartment (Fig. 5i and Extended Data Fig. 9g), which was consistent with our sc/snRNA-seq results (Extended Data Fig. 9h) and with the expected behaviour of immature progenitor cells. These findings overall suggest that neuroepithelial-like-2 cells are both highly migratory (Fig. 5d) and highly proliferative (Fig. 5i). These complementary phenotypes could enable neuroepithelial-like-2 cells to have critical functions in tumour progression, driving both tumour expansion and migration to other brain regions.
Finally, to distinguish species-specific and cell-type differences in microenvironmental cues, we cocultured ZFTA-RELA cells with human induced pluripotent stem (iPS)-cell-derived excitatory neurons and astrocytes and performed 10x scRNA-seq and live-cell imaging (Extended Data Fig. 10). The results were consistent with those from coculture with rat E19 cortical cells, highlighting that these phenotypes are conserved across rat and human microenvironmental contexts.
Taken together, these results suggest that ZFTA-RELA transcriptomic cellular states have distinct morphological and behavioural attributes in the context of their native neuroglial microenvironment. We further confirm these patterns across species, underscoring the phenotypic heterogeneity of these cancer cell states influenced by the tumour microenvironment, which collectively contributes to tumour progression.
Our study identifies different malignant cell states as well as developmental signatures across molecular subgroups of ST-EPN tumours, including previously uncharacterized non-canonical ST-ZFTA tumours3. Moreover, we demonstrate that individual cell states in ZFTA-RELA tumours have distinct spatial, morphological and behavioural characteristics.
We introduce a comprehensive dataset of tumours of patients with ST-EPN and highlight a clear discrepancy in both developmental signatures and differentiation lineages of different ST-EPN subgroups. These distinct developmental signatures and perturbed lineage differentiation across subgroups lay the groundwork for developing much-needed personalized therapeutic strategies for these tumours. Importantly, while clear differences in patient outcome have been described in comparisons between ZFTA-RELA with ST-YAP12,42, and there are some case studies comparing ZFTA-RELA, ZFTA cluster 2 and ZFTA cluster 442,43, there is an urgent need for a comprehensive clinical study comparing patient outcomes and therapeutic resistance across all defined molecular subgroups in ST-EPN tumours to further apply the findings from this study.
Building on our description of molecular cellular states across ST-EPN tumours, we also characterized how cellular states are spatially organized within ZFTA-RELA tumours. We first highlight hypoxia as an element of global structural organization. Notably, this has also been described in adult gliomas14, highlighting this as a potential common mechanism across brain tumours. Despite hypoxia being described as critical for metabolism and epigenetic regulation in posterior fossa ependymomas44, its role in ST-EPNs has been underappreciated. It would therefore be of interest for future studies to examine hypoxia-driven tissue structural changes and their functional implications directly in ST-EPN tumour models. We also highlight an inverse relationship of embryonic-neuronal-like state to global spatial organization, raising questions regarding the extent of tumour microenvironment remodelling in the presence of this cell state and its therapeutic significance. Furthermore, local tumour structures are predominantly enriched for certain malignant cellular states, also described as state-specific clustering in gliomas14. This common phenomenon across brain tumours suggests that spatial location is a key regulator of cellular state.