
Liquid biopsies targeting cfDNA analytes are emerging as a promising noninvasive diagnostic approach, with clinical potential in prenatal testing11,12, disease diagnosis10,13,14 and transplantation monitoring15,16,17. However, an inability to determine tissues of origin and limited efficiency with low cfDNA abundance as well as profound heterogeneities of genetic variations among patients preclude widespread applications18,19,20,21,22. Plasma cell-free nucleosomes have been assayed by cell-free immunoprecipitation (cfChIP)10,23,24, imaging25, enzyme-linked immunosorbent assay26 and mass spectrometry27 to yield molecular information on diseased cell types. Inference of tissue of origin in plasma cfChIP has been performed on the basis of the assumed positive correlation between trimethylation of K4 of histone H3 (H3K4me3) and gene transcription10. Yet, H3K4me3 is insufficient to interpret gene regulatory mechanisms underlying tissue pathogenesis and changes in cell states without accompanying transcriptional changes28,29,30,31,32,33,34.
Here we develop cf-EpiTracing, an automation platform for capturing a combination of cell-free histone modifications from trace quantities of human plasma with high sensitivity. cf-EpiTracing not only enables early-stage disease detection, but also stratifies patients with lymphoma into subtypes with different molecular underpinnings and disease progression stages as well as therapeutic response. As a proof of concept, cf-EpiTracing-defined epigenetic signatures outperform existing clinical indices in predicting prognosis in patients with colorectal cancer (CRC) or lymphoma.
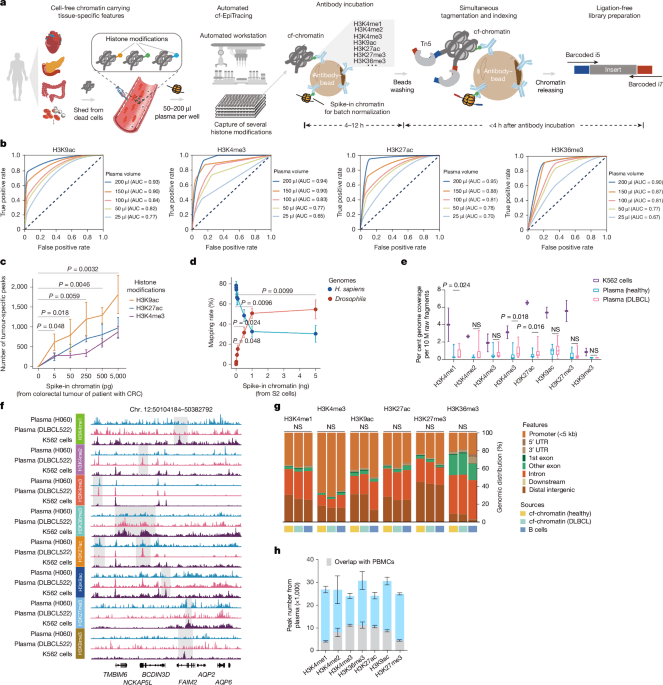
We developed cf-EpiTracing, a method implemented on a Biomek i5 automated workstation to capture genome-wide multiple cell-free histone modifications in human plasma (Fig. 1a and Methods). In brief, antibodies against histone modifications were covalently conjugated to paramagnetic beads. To control for batch effect and sample variations, each 25–200 μl plasma sample was spiked with lightly fixed chromatin derived from Drosophila S2 cells. Distinct from cfChIP, in which adapters for PCR amplification and sequencing are attached by on-bead ligation, cf-EpiTracing incorporates barcoded adapters into immobilized DNA fragments via Tn5 transposase tagmentation (Supplementary Tables 1 and 2). The follow-up steps, such as DNA releasing and library preparation, are finished in the same well. Of note, the cf-EpiTracing design relies on a two-round barcoding strategy to achieve high throughput, facilitating the parallel processing of multiple samples in 96-well plates. Simplified procedures allow efficient profiling of cell-free epigenomes in hundreds of samples within 6 h after antibody incubation.
a, The cf-EpiTracing experimental workflow. b, Receiver operating curves for cf-EpiTracing data with varying volumes of human plasma. Merged cf-EpiTracing signals from 200 μl plasma from healthy donors (n = 125) were used as gold standard. c, Plasma from representative healthy individuals (n = 3) was spiked with varying amounts of fragmented chromatin from a colorectal tumour of a patient with CRC (stage III). The top 10,000 peaks were selected for peak calling in both plasma and tumour tissue. P values are shown for H3K9ac. d, Plasma from a representative healthy individual was spiked in with varying amounts of fragmented chromatin of Drosophila S2 cells. The graph shows mapping rate of raw reads to the Homo sapiens or Drosophila genomes. Data represent three biological replicates for H3K4me3, H3K27ac and H3K36me3. e, Normalized genome coverage of peak regions from ChIP–seq data of K562 cells (n = 2) and cf-EpiTracing data from healthy individuals (n = 15) or patients with DLBCL (n = 15). In box plots, the centre line is the median, box edges delineate first and third quartiles and whiskers extend to 1.5× interquartile range. f, Track view of cf-EpiTracing signals for eight histone modifications from a healthy individual (H060, blue), a patient with DLBCL (DLBCL522, pink), and K562 cells (purple). Genomic regions with dynamic signals across three samples are highlighted in grey boxes. g, Genomic feature distribution of cf-EpiTracing peaks of cf-chromatin from healthy individuals (n = 15), patients with DLBCL (n = 15) and ChIP–seq peaks of B cells (n = 3). Mean genomic distribution percentage for each feature was calculated among samples. UTR, untranslated region. h, Peak numbers of multiple histone modifications in cf-EpiTracing profiles from all healthy donors (n = 125). Grey boxes show overlaps with PBMC peaks. Data are expressed as mean ± s.d (c,d,h). P values by t-test (two-sided, c–e) and two-sided Kruskal−Wallis test (g). NS, not significant.
Streamlined cf-EpiTracing enables measurement of various epigenomic modalities with small amounts of sample. After normalization with the spike-in Drosophila chromatin reference35,36, batch effects and sample variations are well controlled and corrected (Extended Data Fig. 1a). cf-EpiTracing demonstrated high peak accuracy with samples ranging from 50 μl to 200 μl (area under the curve (AUC), 0.77–0.95), and lower accuracy with 25 μl samples (Fig. 1b and Extended Data Fig. 1b). To further examine the detection sensitivity of target signals, we performed a titration of fragmented chromatin from CRC tumour tissues or Drosophila S2 cells added into plasma from healthy donors. External signals with as little as 0.005 ng equivalent chromatin were reliably detected in healthy plasma (Fig. 1c,d).
We performed cf-EpiTracing with plasma samples from healthy individuals and from patients with diffuse large B cell lymphoma (DLBCL) for multiple histone modifications, marking active promoters (H3K4me2, H3K4me3, acetylation of K9 of histone H3 (H3K9ac) or H3K27ac), primed and active enhancers (H3K4me1, H3K4me2, H3K9ac or H3K27ac), gene body of active genes (H3K36me3) and repressive regions (H3K9me3 or H3K27me3) (Fig. 1e and Supplementary Table 3). Good reproducibility of cf-EpiTracing data was confirmed in plasma from self-reported healthy donors for each histone modification (Extended Data Fig. 1c). Notably, we observed a high correlation between plasma and blood cells within the same histone modification, with evident distinction between different histone modifications in most cases (Extended Data Fig. 1d).
Furthermore, we benchmarked cf-EpiTracing with cfChIP methods10,23. As expected, Tn5 tagmentation of cell-free chromatin (cf-chromatin) predominantly produced sub-nucleosome patterns (median 123 bp) compared with the directly purified cfDNA or ligation-based cfChIP fragments (median around 170 bp; Extended Data Fig. 2a). Compared with the public cfChIP data from approximately 2 ml of human plasma10, cf-EpiTracing with 200 μl of plasma exhibited overall comparable signals, but a better signal-to-noise ratio and increasing peak accuracy, using either cfChIP or cf-EpiTracing peaks as gold standard (Extended Data Fig. 2b–d). In a pairwise comparison, cf-EpiTracing outperformed cfChIP across different plasma volumes from the same samples (Extended Data Fig. 2e). Next, we determined the abundance of histone modifications in human plasma by examining the normalized genome coverage of peak regions in healthy individuals and patients with DLBCL (Fig. 1e,f). Among eight screened histone modifications, H3K9ac, H3K27ac and H3K36me3 were most prevalent in cf-chromatin. Repressive histone modifications (H3K27me3 and H3K9me3) were abundant in K562 cells but showed limited peaks and coverage in plasma. Patients with cancer exhibited discernible levels of global histone modifications in plasma cf-chromatin, particularly H3K4me1, H3K27ac and H3K36me3, compared with healthy controls (Fig. 1e). Owing to its lower abundance in plasma and relatively limited dynamics across tissues and cells37, H3K9me3 was excluded from further analyses. The cf-EpiTracing data from healthy donors and patients with DLBCL showed similar genomic distribution patterns to those in tissues and primary cells (Fig. 1g). Notably, we observed considerable plasma-specific signals in each histone modification, probably released from non-peripheral blood mononuclear cell (PBMC) remote tissues (Fig. 1h). Together, these results demonstrated that cf-EpiTracing provided an efficient, robust automated framework for genome-wide profiling of multiple histone modifications with high sensitivity using as little as 25 μl of human plasma.
ICSs for inferring tissue of origin
We next initiated integrated analyses to delineate tissue or cell type-specific signatures, referred to as integrated chromatin states (ICSs). These ICSs infer specific regulatory signatures in tissues or cells by jointly quantifying combinatorial presence and absence of histone modifications across the reference epigenome, encompassing 7 histone modifications derived from 65 tissues and primary cells (downloaded from BLUEPRINT38, Roadmap Epigenomics39 and ENCODE40 projects; Fig. 2a, Extended Data Fig. 3a and Supplementary Table 4). Our analysis focused on regulatory regions with the chromatin activity and cell type specificity, rather than relying on each of these histone modifications. We trained an 18-ICS ChromHMM41 model consisting of 13 active and 5 repressed ICSs (Extended Data Fig. 3b,c and Supplementary Table 5). Benchmarking the capacity of distinguishing all 65 tissues and primary cells, we showed that the ICSs, particularly those denoted by H3K27ac, H3K4me3 and H3K9ac, exhibited the highest variability and tissue specificity (Extended Data Fig. 3d). Subsequently, we defined a compendium of tissue-specific signatures comprising thousands of genomic regions for each tissue and cell type (Methods). The ICSs of cf-chromatin were subjected to deconvolution for tissue and cell type-specific signatures and scored for potentially regulated genes, facilitating tracing of tissues or cell types of origin and delineation of regulatory events (Fig. 2a).
a, Schematic of the computational pipeline for identification of tissue-of-origin signatures and disease screening. b, PCA visualization of 10 representative tissues and primary cells (n = 5 each) using signals in genomic regions of signatures for 65 tissues and primary cell types defined by 18 tissue-specific ICSs. Signals in these genomic regions were computed using combined histone modifications from ChIP–seq datasets. c, Heat map showing k-means clustering performance using indicated combinations of histone modifications in tissues and primary cells. d, PCA visualization of patients with DLBCL (n = 15) and healthy individuals (n = 15) using signals in genomic regions for B cell signatures defined by 18 tissue-specific ICSs. Signals in these genomic regions were computed using combined histone modifications from plasma cf-EpiTracing data. e, Heat map showing k-means clustering performance using indicated combinations of histone modifications in plasma. f, PCA visualization (left) and correlation heat map (right) of 10 representative tissues and primary cells (n = 5 each) based on signals in genomic regions for tissue-specific signatures of all 65 tissues and primary cells. Tissue-specific signatures in ICS1 (Znf/Rpts), ICS2 (Het), ICS3 (Quies1), ICS4 (ReprPCWk), ICS5 (ReprPC), ICS8 (Quies2), ICS10 (TxWk) and ICS11 (Tx) were removed from analyses. The signals in these genomic regions of tissue-specific signatures were computed using the top three histone modifications with the highest performance in clustering tissues and cells, as identified in c. g, PCA visualization (left) and correlation heat map (right) for patients with DLBCL (n = 15) and healthy individuals (n = 15) using signals in genomic regions for tissue-specific signatures of B cells. Tissue-specific signatures in ICS1, ICS2, ICS3, ICS4, ICS5, ICS8, ICS10 and ICS11 were removed from analyses. The signals in genomic regions for tissue-specific signatures were computed, using the top three histone modifications with the highest performance in clustering plasma samples, as identified in e.
We first tested the minimum requirement of histone modifications to accurately capture intra-tissue variabilities. We conducted principal component analysis (PCA) clustering on 10 representative tissues and cells, leveraging detected signals in genomic regions of tissue-specific 18-ICS defined signatures (Fig. 2b). Signals were calculated by integrating chromatin immunoprecipitation with sequencing (ChIP–seq) data involving different combinations of histone modifications to generate ICSs for each tissue or cell type. A combination of H3K4me3, H3K9ac and H3K27ac had the largest effect, as evidenced by the decrease upon exclusion of each with normalized mutual information (NMI) and adjusted Rand index (ARI) in k-means clustering (Fig. 2c). Hierarchical clustering analyses further supported the predominant contribution of these three histone modifications in classifying tissues or cell types (Extended Data Fig. 4a,b). Consistent with these results at the tissue and cell level, H3K4me3, H3K9ac and H3K27ac cf-EpiTracing together proved effective in detection of the signatures associated with diseased tissues and cell types in patients with cancer (Fig. 2d,e and Extended Data Fig. 4c,d). Notably, we observed no substantial loss of accuracy in unsupervised clustering of tissues and cell types or plasma samples when adopting these top three contributing histone modifications in the integration analyses (Extended Data Fig. 4e,f).
The ChromHMM framework effectively leverages state transition probabilities to accurately infer chromatin states, even when using a subset of histone modifications. We noted that inferring 18 ICSs solely through integrating these top three contributing histone modifications provided limited interpretation of ICSs associated with heterochromatin and transcriptional repression. These ICSs are less distinguishable by signals in H3K4me3, H3K9ac and H3K27ac. Therefore, we prioritized the selection of the ten most informative ICSs that are fully characterized using H3K4me3, H3K9ac and H3K27ac (ICS6, ICS7, ICS9 and ICS12–18) in downstream applications. Our data showed that exclusion of other chromatin states, which could not be directly distinguished by these three histone modifications, did not materially affect the performance of cf-EpiTracing in classifying tissues, cells and plasma samples (Fig. 2f,g).
We assessed the accuracy and specificity of cf-EpiTracing in capturing tissue-of-origin signatures across diverse patient cohorts. These cohorts included age-matched healthy individuals (n = 125) and patients with CRC (n = 107), coronary heart disease (CHD; n = 23) and various subtypes of B cell lymphoma (n = 309; Extended Data Fig. 5a), spanning various stages of in-treatment and pre-treatment from multiple clinical centres (Supplementary Table 6). Our unbiased screening quantified genomic regions for tissue-specific signatures and nominated primary diseased, affected and involved tissues across the body (Fig. 2a and Methods). To assess the sensitivity, we first ascertained the detection of elevated tissue signatures, which were well-correlated with diseases. As expected, we observed prominent signatures from digestive tissues, cardiac tissues and B lymphoid cells in the cf-chromatin of patients with CRC, CHD and B cell lymphoma, respectively (Fig. 3a and Extended Data Fig. 5b,c). Tissue signature ICSs associated with primary diseased tissues readily differentiated patients from healthy individuals and from one another in the generalized linear models (GLMs; Methods). The GLM classifier exhibited robust performance in distinguishing patients with CRC (AUC = 0.965; sensitivity=0.864; specificity=0.924), CHD (AUC = 0.971; sensitivity=0.800; specificity=0.963) and B cell lymphoma (AUC = 0.963; sensitivity=0.839; specificity=0.962) from other individuals in testing groups (Fig. 3b). A global survey of tissue signatures across disease types versus healthy individuals revealed evident signatures from the immune system in addition to the signatures from the primary diseased tissues, indicating possible inflammation and immune dysregulation in patients (Fig. 3c)
a, Heat map showing tissue-of-origin signals from diseased tissues (colorectum, heart and lymphocyte) across healthy individuals and patients with CRC, CHD or lymphoma. Rows are representative tissue signature ICSs associated with diseased tissues. The heat map was scaled by row. b, Receiver operating characteristic (ROC) curves showing binary classification performance of tissue signatures associated with primary diseased tissues in patients with CRC, CHD or lymphoma in the training (80% of samples) and test (20% of samples) groups. GLMs were used. Non-CRC individuals refer to all healthy individuals and patients with CHD or lymphoma collectively. Non-CHD individuals refer to all healthy individuals and patients with CRC or lymphoma collectively. Non-lymphoma individuals refer to all healthy individuals and patients with CRC or CHD collectively. c, Top five tissue-specific ICSs with highest log2-transformed fold change in patients compared with healthy individuals. d, Heat map showing mean tissue enrichment scores for ten representative tissues for individuals from different groups. The heat map was scaled by row. e, Exemplification of the comparison of identified affected tissues between cf-EpiTracing and corresponding clinical data. Heat map showing prevalence of organ involvement of ten representative organs in patients with lymphoma or CRC. Organ involvements were assessed by CT and PET–CT. f, Violin plots showing tissue enrichment scores for representative organs in patients with (n = 27) or without (n = 180) evidence of involvement of corresponding organs, as well as in healthy individuals (n = 125). In box plots, the centre line is the median, box edges delineate first and third quartiles and whiskers extend to 1.5× interquartile range. P values by two-sided t-test. g, Spider plots showing tissue enrichment scores for ten representative organs in healthy individuals, and patients with CRC, CHD or lymphoma. Five representative individuals are shown in each panel. Tissue enrichment scores for all individuals are shown as heat maps in Extended Data Fig. 5i.
We next showcased the application of cf-EpiTracing in non-cancer disease, exemplified by inflammatory bowel disease (IBD), which affects the same organ as CRC. The significant signals identified from colorectal tissues of patients with IBD were intermediate between those from patients with CRC and those from healthy individuals (Extended Data Fig. 5d). Although IBD and CRC affect the same organ, patients with IBD can be readily distinguished from patients with CRC (Extended Data Fig. 5e).
The onset of disease often entails the involvement of additional tissues beyond the primary pathogenic sites, underscoring the necessity for an unbiased evaluation of tissues as many as possible. To monitor epigenetic signatures from primary diseased, affected or involved tissues individually without reference to any available clinical information, we developed a screening model to achieve unbiased determination of pathogenic tissues by gating patient plasma tissue-of-origin signatures with healthy counterparts. In brief, we observed that signals in tissue-signature ICSs followed a normal distribution in the healthy population (Extended Data Fig. 5f,g). Subsequently, we fitted normal distributions for each tissue-signature ICS in healthy individuals for each type of tissues and primary cells, establishing a healthy control reference. Selected tissue-signature ICSs, representing the most markedly altered tissue-derived signals in patients, were identified and used to score tissue enrichment. A higher score indicates a greater degree of deviation from the control (Methods).
Consistently, patients with different diseases exhibited distinct patterns of tissue enrichment scores, which often corresponded with the tissues involved (Fig. 3d). For example, enrichment scores for heart, colorectum and lymphocytes were exclusively elevated in patients with CHD, CRC and lymphoma, respectively. Additionally, we observed distinct patterns of enrichment scores in tissues that were not directly associated with primary diseased tissues. In the case of patients with CRC, noticeable differences were observed in liver, potentially attributed to the increased risk of liver metastasis in patients with CRC42,43. Of note, only three patients with CRC had a clinical diagnosis of liver metastasis at the time of sampling. These findings highlight the sensitivity of the analytic pipeline for detecting signatures that are indicative of early-stage tissue involvement before clinical symptoms become apparent. Similarly, elevated signatures contributed by breast, pancreas and spleen were found in patients with B cell lymphoma, which may be partially explained by the high prevalence of extranodal involvement in patients with lymphoma (Supplementary Table 7). Notably, these changes were consistent with the prevalence of organ involvement revealed by available clinical information (Fig. 3e,f). Correlation between enrichment patterns and bona fide tissue involvement was not tested in patients with CHD, owing to a lack of clinical computed tomography (CT) and positron emission tomography–computed tomography (PET–CT). No significant difference was observed in enrichment scores for irrelevant tissues (Extended Data Fig. 5h). Our diagnostic model accurately identified tissue alterations corresponding to disease types in each screened individual (Extended Data Fig. 5i). For example, healthy individuals did not exhibit evident abnormalities in representative tissues. The most prominently increased signatures in patients with CRC, CHD and lymphoma originated from the colorectum, heart and lymphocytes, respectively (Fig. 3g). Notably, we observed a significant graded distribution of enrichment scores for tissues such as lymphocytes, spleen and liver between healthy individuals of different ages (below 50, 50–70 and over 70 years of age) (Extended Data Fig. 5j,k). This observation suggested an age-related increase in the susceptibility to morbidity associated with tissue lesions, particularly in the immune system.
Tracing tissue-of-origin signals derived from diseased tissues facilitated the accurate classification of colon and rectal cancer subtypes, demonstrating high accuracy even in early-stage disease (Extended Data Fig. 6a–c). Nevertheless, this provided limited insights for therapeutic guidance—particularly in the context of advanced CRC, in which treatment modalities have shown substantial efficacy but predominantly only within limited patient subpopulations44.
We next used cf-EpiTracing for early-stage lesion detection in individuals without cancer and assessment of progression in patients with CRC in a discovery dataset (n = 93 healthy; n = 75 CRC) and then evaluated in an independent validation dataset (n = 32 healthy; n = 32 CRC; Fig. 4a). In addition to deciphering tissue-of-origin signatures in diseases, cf-EpiTracing facilitates the non-invasive assessment of alterations in gene regulatory states by examining cf-chromatin ICSs (Methods). To verify whether CRC-specific ICSs identified in plasma by cf-EpiTracing were indeed contributed by related tumour tissues, we profiled histone modifications in paired plasma and tumorous colorectal tissues from four patients (Fig. 4b). We identified cancer-specific ICSs in each patient compared with healthy individuals, using both cf-chromatin and tissue-chromatin. A significant overlap of cancer-specific ICSs in tumour tissues (average 33.8%) was captured in paired human plasma, but was rarely observed in non-cancer and shuffle controls (Extended Data Fig. 6d–f). For example, pronounced alterations in histone modifications around the CFLAR (which functions in anti-apoptosis45) and CDK19 (which functions in cell cycle46) loci were consistently captured in patient plasma and paired tumour tissues (Extended Data Fig. 6g). Notably, cancer-specific signatures detected from plasma and tumour tissues were well-correlated (Spearman’s ρ = 0.64; Extended Data Fig. 6h). Cancer-specific ICSs in both plasma and tumour tissues exhibited strong heterogeneities among patients, emphasizing the importance of systematic screening and stratification in cancer management (Extended Data Fig. 6i).
a, Flow diagram depicting applications of cf-EpiTracing in non-invasive precancerous lesion detection and prognostic stratification in patients with CRC. b, Venn diagrams exemplifying that a fraction of cancer-specific ICSs in colorectal tumour tissues overlapped with cancer-specific ICSs in matched plasma samples from the same individuals (n = 4). c, Schematic of the study design for training and validation of CRC-Healthy XGBoost classifier. d, Confusion matrices showing the classification performance of the model by comparing prediction and ground truth in training (left) and validation (right) groups. e, Bar plots showing the classification performance of the model in training and validation groups. f, Ridge plot showing performance evaluation of the classification model across training and validation groups, along with CRA samples. Patients with CRA who were predicted to exceed the classification threshold (0.5, grey line) were defined as correctly detected. g, Box plots showing scores of ICS markers used in the XGBoost classifier and clinical indices in healthy individuals (n = 125) and patients with CRA (n = 22) or CRC (n = 107). Blue lines indicate the upper reference limits for clinical indices. In box plots, the centre line is the median, box edges delineate first and third quartiles and whiskers extend to 1.5× interquartile range. h, Heat maps showing the relative scores of CRC-specific ICSs (747, identified by DESeq2 using CRC and healthy samples in the discovery dataset) and CRA-specific ICSs (74, identified by DESeq2 using CRC and healthy samples in the discovery dataset and 22 patients with CRA). Representative ICSs are listed on the right. i, Kaplan–Meier survival curves of progression probability for individuals with CRC-1 and CRC-2 in the discovery (top) and validation (bottom) datasets. P values by hypergeometric test (two-sided, b); two-sided t-test (g); and two-sided log-rank test (i).
To identify cf-EpiTracing markers for early diagnosis, we first interrogated differential ICSs between patients with colorectal precancerous lesions (colorectal adenoma (CRA)) and healthy individuals in the discovery dataset (Extended Data Fig. 6j). As expected, we observed significant activation of transcription factor genes implicated in the cell cycle, proliferation and apoptosis, represented by CDK14, along with repression of tumour suppressor genes such as DICER1 in patients with CRA. We next investigated different epigenetic modalities in coordinating transition from precancerous lesions to tumour. A total of 747 differential ICSs between patients with CRC and healthy individuals were identified in the discovery dataset and used in XGBoost machine learning to establish a CRC–healthy classifier and detect colorectal precancerous lesions (Fig. 4c). The XGBoost model yielded robust CRC–healthy classification performance in both training (accuracy, 0.976) and independent validation group samples (from different hospitals and not used for feature selection or model building; accuracy, 0.922; Fig. 4d,e and Extended Data Fig. 6k). We next tested whether the CRC–healthy classifier could facilitate unbiased assignment of patients with CRA, neither relying on established CRA markers nor including patients with CRA in the training process. This model was next adapted for the detection of patients with CRA by determining whether patients with CRA were more likely to be classified as healthy individuals or patients with CRC (Fig. 4f and Extended Data Fig. 6l). Our model achieved a true detection rate of 77.27% for patients with CRA, outperforming existing clinical indices such as CEA (carcinoembryonic antigen) and CA125 (cancer antigen 125), which performed poorly in distinguishing patients with CRC or CRA from healthy individuals (Fig. 4g). As expected, we observed a significant graded distribution of scores for top-ranking ICSs in the model (for example, MLIP.ICS9 and CCL28.ICS9; Fig. 4g).
Coincident with well-recognized high heterogeneity in patients with CRC, we stratified patients into two subgroups (CRC-1 and CRC-2) based on distinct patterns in 747 differential ICSs in the discovery and validation datasets (Fig. 4h). Notably, we did not effectively resolve patient subgroups based on ages or clinical stages (Extended Data Fig. 6m). Additionally, we identified ICSs associated with key molecules, such as RUNX2, RASA4B and TXNIP, which were exclusively enriched in patients with CRA compared with healthy individuals and patients with CRC in the discovery dataset. These findings were further verified in the validation dataset.
Moreover, we observed significantly different prognoses between patients with CRC-1 and CRC-2 in both discovery and validation datasets, with CRC-1 exhibiting a significantly higher risk of disease progression (Fig. 4i). Collectively, our results suggest that cf-EpiTracing holds great promise as a non-invasive tool for early diagnosis, patient stratification and prognosis prediction, and outperforms currently available clinical indices.
DLBCL, follicular lymphoma (FL) and mantle cell lymphoma (MCL) are subtypes of B cell lymphoma characterized by different diseased cell types of origin and prognosis (Fig. 5a). These entities are clinically defined through gene expression profiling derived from frozen tissues47. To identify tumour-derived signals indicative of diseased cell type of origin from plasma, we first verified that the cancer-specific ICSs detected by cf-EpiTracing were indeed from related tumour tissues in patients with B cell lymphoma (Extended Data Fig. 7a–h). Indeed, substantial differences were observed among B cell lymphoma subtypes in cf-EpiTracing signals across multiple histone modifications (Fig. 5b). To further explore potential distinction in gene regulation implicated in B cell lymphomas subtypes, we performed differential analysis of ICSs and identified 65, 6 and 8 specific ICSs for corresponding subtypes. We next used hierarchical clustering of patients with B cell lymphoma based on 79 subtype-specific ICSs or differentially expressed genes (DEGs) defined by bulk RNA sequencing (RNA-seq) in tumour tissues (Extended Data Fig. 8a,b). We observed comparable subtyping performance using subtype-specific ICSs compared with RNA-seq defined DEGs (Extended Data Fig. 8c).
a, Schematic of B cell development and associated lymphoma subtypes. b, Track views at representative subtype-specific loci. c, Heat map showing ICS signals of cell type-specific signatures of B cells across B cell lymphoma subtypes. d, Multi-class classification of B cell lymphoma subtypes using ICS signals in B cell-specific signatures. e, Heat map of ICS signals for CD34+ and GCB cell signatures in DLBCL subtypes. f, Classification performance distinguishing DLBCL subtypes on the basis of differential ICS signals of CD34+ and GCB signatures. g, Pseudotime analysis of transformation from FL to DLBCL. Each dot represents a sample from DLBCL (n = 170), FL (n = 65) or tFL (n = 15) from 6 patients at multiple timepoints. h, Heat map of ICS signals for CD34+ (DLBCL) and GCB (FL) signatures, along with correlated ICS marker scores in FL, tFL and DLBCL. Scores for FL and DLBCL are shown as mean values. tFL samples are ordered by CD34+ signature strength. Numbers prefixed by tFL denote patient ID and numbers prefixed by T denote timepoint. i, Transcription factor (TF) motif enrichment in genomic regions with active chromatin states in DLBCL and tFL compared to FL. P values were adjusted by Benjamini–Hochberg correction. j, XGBoost model predicting DLBCL scores in healthy individuals and patients with DLBCL. Dashed lines denote training cut-offs. r.m.s.e., root mean squared error. k, ROC curve and confusion matrix showing classification performance in the validation cohort. l, Multivariate Cox proportional hazards analysis of recurrence risk in DLBCL (27 events in 141 individuals). P values were adjusted by Bonferroni correction in the discovery dataset but not in the validation dataset. Error bars indicate 95% confidence intervals and the centre dot is defined as the hazard ratio. β2-MG, β2-microglobulin; LDH, lactate dehydrogenase; WBC, white blood cell. m, Kaplan–Meier survival curves for overall survival in patients with DLBCL stratified by low or high integrated ICSs or clinical indices. P values by one-sided hypergeometric test (i), two-sided Wald log-likelihood test (l) and two-sided log-rank test (m).
Next, we explored whether de novo detection of cell type-of-origin signatures was sufficient for subtyping patients with B cell lymphoma. We examined the sensitivity of cf-EpiTracing in capturing tissue signatures indicative of disease cell type of origin, by adding varying amounts of plasma from patients with DLBCL to healthy plasma (Extended Data Fig. 8d). A minimal spike-in of 1% DLBCL plasma provided sufficient signals from B cells, supporting the superior sensitivity of cf-EpiTracing (Extended Data Fig. 8e,f). Based on the distinction of cell types-of-origin signatures from CD34-positive cells, naive B cells and germinal centre B cells (GCBs), patients with B cell lymphoma exhibited three well-separated groups, in concordance with corresponding reported diseased cell types of origin (Fig. 5c). Incorporating the relative contributing signals in these three cell type-specific signatures, we observed strong classification performance for distinguishing B cell lymphoma subtypes. Multi-class classification across all patients with B cell lymphoma yielded a multi-class AUC of 0.823 (Fig. 5d). These results highlighted the potential of cf-EpiTracing in non-invasive subtyping of the diseases at cell type resolution.
We used cf-EpiTracing to trace back cell types of origin in two DLBCL subtypes, GCB and non-GCB subtypes. Despite sharing the majority of features, these subtypes differ in their pathogenic cell types of origin. DLBCL subtype-specific ICSs (n = 474 for GCB DLBCL and n = 192 for non-GCB DLBCL) were used in hierarchical clustering heat maps for the assessment of subtyping performance, manifesting overall comparable and even superior classification performance (accuracy, 93.22%) to that using RNA-seq defined DEGs (accuracy, 89.76%) (Extended Data Fig. 8g–i). As expected, we observed increasing signals in cell type-specific signatures of GCBs but decreasing signals in cell type-specific signatures of CD34-positive cells in the GCB subtype (Fig. 5e). This finding is consistent with the fact that GCB DLBCL carcinogenesis originates from GCBs and exhibits lower malignancy compared with the non-GCB subtype48. Hierarchical clustering of patients based on cell type-specific ICSs for GCBs and CD34-positive cells demonstrated the robust performance (accuracy, 90.68%) for distinguishing DLBCL histological subtypes, in which Hans classification was set as gold standard (Fig. 5f).
We next tested whether cf-EpiTracing data were able to uncover the progression of disease subtype transformation. A critical event in the progression of FL involves the histological transformation into an aggressive B cell lymphoma characterized by worse outcome and lower sensitivity to therapy, most commonly DLBCL49. To identify the epigenetic mechanism underlying such pathogenesis, we conducted cf-EpiTracing with 15 samples at various timepoints from 6 patients with transformed FL (tFL) who were clinically diagnosed with partial characteristics of DLBCL. All samples from patients with tFL exhibited an intermediate state along the trajectory of transformation from FL to DLBCL (Fig. 5g). Alongside the path for the gain of cell-of-origin signals for DLBCL (CD34-positive cells) and the loss of cell-of-origin signals for FL (GCBs), we detected 26 ICSs that were significantly linked to the transformation process. This analysis also revealed epigenetic dysregulation in genes associated with lymphocyte proliferation, such as IL17RD and TCF7L2 (Fig. 5h). We set out to identify potential transcription factors involved in such transformation by transcription factor motif enrichment analysis in genomic regions of active chromatin states in patients with tFL or DLBCL compared to patients with FL (Fig. 5i). We showed a progressive enrichment of proliferation-related transcription factors, including BCL6 and MYC, which are well-established markers for clinically assessing prognosis in patients with lymphoma50,51,52. Remarkably, we also noted an increasing enrichment of development-associated transcription factors, such as IRF4 and EBF3, even in early stages of transformation, implicating them as potential pioneer factors in triggering this disease transformation.
Patients with DLBCL display remarkable heterogeneity in clinical stages and prognosis48,53. For early disease detection, we aimed to analyse the difference of magnitude in DLBCL-specific ICSs among patients with DLBCL of different stages (Supplementary Table 7). We established an XGBoost machine learning model to predict DLBCL scores in healthy individuals and patients with DLBCL at different clinical stages based on 432 DLBCL-specific ICSs compared to healthy controls in samples of discovery dataset (Extended Data Fig. 9a,b). Our model revealed a discernible trend, with advanced-stage cases exhibiting higher DLBCL scores compared with early-stage cases as well as healthy individuals in both training and independent validation group samples (Fig. 5j). Using the machine learning model-defined DLBCL score cut-offs for patients with DLBCL of different stages in training group samples, our model achieved overall high classification accuracy in validation group samples for early-stage (stage I and II; accuracy, 0.78) and advanced-stage (stage III and IV; accuracy, 0.89) patients and healthy individuals (accuracy, 0.85), with a multi-class AUC of 0.942 (Fig. 5k and Extended Data Fig. 9c).
Therapies such as R-CHOP (rituximab plus cyclophosphamide, dhorubicin, oncovin and prednisolone) are the standard first-line treatment for DLBCL53. However, only a subset of patients with DLBCL achieve durable benefits from these therapies, highlighting a critical unmet need for reliable biomarkers to predict patient prognosis as early as possible. We attempted to non-invasively assess the treatment response to R-CHOP-like therapies in patients with DLBCL using cf-EpiTracing. A longitudinal follow-up was conducted among participants with DLBCL (n = 141) in conditions of either complete response (n = 44), partial response (n = 60) or stable disease (n = 37) at the time point of sample collection. Recurrence was observed in a subset of patients in the follow-up study after an average of 118.6 weeks (n = 27 events in 141 individuals). Multivariate Cox proportional hazard analysis, starting from 432 DLBCL-specific ICSs, identified 8 markers significantly associated with the risk of future recurrence in discovery dataset after Bonferroni correction (Fig. 5l). These ICSs, predictive of disease progression, were subsequently verified in an independent dataset, showing a significant association with patient prognosis and highlighting the potential broad clinical applicability and generalizability. Notably, no significant association with recurrence was observed by current clinical indices (Fig. 5l and Extended Data Fig. 9d). The performance of the cf-EpiTracing-defined recurrence-associated ICSs in predicting prognosis was next evaluated in the discovery and independent validation datasets using individual recurrence-associated ICSs and integrated ICS scores (Methods). Patients were stratified into high-risk and low-risk groups using cut-offs derived from the discovery dataset. This classification yielded a significant distinction in survival outcomes between two groups (Kaplan–Meier analysis; Fig. 5m and Extended Data Fig. 9e). No significant differences in overall survival were observed between patients with high or low levels of integrated clinical indices (for example, International Prognostic Index (IPI) level). Together, these results affirmed that cf-EpiTracing was capable of disease subtyping, high-resolution early diagnosis and therapeutic outcome prediction in B cell lymphoma.
Genetic and epigenetic changes in MCL
MCL is a malignant neoplasm, putatively driven by the t(11;14) translocation event of immunoglobulin genes and the CCND1 locus, which introduces active chromatin states into target regions such as cyclins, and induces genomic instability and dysregulated gene programs and cell proliferation54,55. To interrogate the relation between genome-wide genetic alternations, epigenetic alternations and pathogenesis, we attempted in-depth analyses of cf-EpiTracing data to simultaneously examine translocation events and cell-free histone modifications (Extended Data Fig. 10a). At the CCND1 locus, downstream of the translocation breakpoint, patients with MCL exhibited markedly increased enrichment of histone modifications at promoters (H3K4me3) and enhancers (H3K4me1, H3K9ac and H3K27ac) compared with healthy individuals (Extended Data Fig. 10b,c). Patients with MCL exhibited significantly increased t(11;14) translocation events at the target locus compared with healthy individuals or patients with FL, highlighting the specificity of cf-EpiTracing to capture pathogenic translocation (Extended Data Fig. 10d and Methods).
To uncover epigenetic alterations involved in MCL lymphomagenesis, we next interrogated epigenetic dysregulation along with the chromosomal translocation in MCL. We observed that a substantial proportion of MCL-specific signatures fell within the enhancers defined by ICSs, indicating that alterations in enhancer chromatin states were the dominant epigenetic responses to chromosomal variability (Extended Data Fig. 10e). Compared with healthy individuals, ICS13 scores of genes within 1 Mb upstream and 1 Mb downstream of the CCND1 locus were significantly increased in cf-chromatin of patients with MCL (Extended Data Fig. 10f). Notably, we observed a significant correlation between the ICS13 scores of these genes and the translocation score defined by the read counts detected with translocation events (t(11;14)) in patients with MCL. These findings further confirmed the interaction of these gene loci with chromosomal translocation events.
Of note, the difference in epigenetic signatures between patients with MCL and healthy individuals decreased with age, suggesting a potential age-dependent disease progression (Extended Data Fig. 10g). Epigenetic heterogeneity among healthy individuals across ages was also tested with ageing-related differential ICSs. Ageing-related ICSs were enriched with biological functions of signal transduction, cell adhesion, cell migration and homeostasis (Extended Data Fig. 10h). By contrast, dysregulated transcription factor genes, such as NEDD4L and CREBBP, which are involved in positive regulation of blood cell proliferation and cell cycle, were over-represented in patients with MCL, but not in healthy older individuals. In conclusion, cf-EpiTracing provided a unique opportunity to simultaneously investigate genomic translocation events and epigenetic alterations in patients with MCL.
Here we develop cf-EpiTracing, a high-sensitivity automated platform for the noninvasive detection of pathological alterations in target tissues or cell types of origin. We have demonstrated potential applications in a variety of clinical scenarios, including early disease diagnosis, unbiased screening of affected tissues, disease subtyping, therapeutic response assessment and biomarker discovery.
Unlike transcription-centric approaches, cf-EpiTracing profiles multiple histone modifications as ICSs to predict tissues and cell types of origin. From eight representative marks, we distilled a minimal combination—H3K9ac, H3K27ac and H3K4me3—without loss of accuracy. The automated workflow achieves unprecedented sensitivity with as little as 50 μl plasma. A limitation, however, is that cf-EpiTracing reduces fragment size and loses fragmentomic features such as end motifs and jagged ends; potential sequence bias, as noted in ATAC-seq (assay for transposase-accessible chromatin with high-throughput sequencing), should also be corrected in transcription factor footprint analyses56.
Notably, cf-EpiTracing revealed that, compared to FL and MCL, DLBCL plasma exhibits stronger signals of CD34-positive cells. This may be attributed to the higher aggressiveness and malignancy of DLBCL, leading to bone marrow involvement, disruption of the bone marrow microenvironment and consequently increasing death of bone marrow cells. Patients with DLBCL also display increased levels of inflammatory factors (such as IL-6), which may mobilize CD34-positive cells into peripheral blood. This finding provides new insights for lymphoma subtype identification and treatment, although the underlying mechanisms warrant further study.
In future, cf-EpiTracing could be integrated with other cell-free modalities—including DNA methylation, mutations and topology9,14,57,58,59,60,61,62. Such multi-omic integration promises unprecedented precision in diagnosing complex diseases63,64. In sum, cf-EpiTracing provides an automated framework for measuring plasma cf-chromatin signatures to infer tissues and cell types of origin, and offers new opportunities to study cellular kinetics of disease progression and treatment response in large patient cohorts.
The research presented in this study complies with all the relevant ethical regulations at their respective centres. Informed consent was obtained from all individuals or their legal guardians before blood sampling. Blood samples of patients with CRC were collected from Shanghai Tongren Hospital Hongqiao International Institute of Medicine and Ruijin Hospital affiliated to the Shanghai Jiao Tong University Medical School. Blood samples of patients with DLBCL, MCL, FL, tFL, TCL or CHD were collected from Peking University Third Hospital. Blood samples of self-claimed healthy individuals were collected and screened from Peking University Third Hospital and Chinese PLA General Hospital. Blood samples of patients with IBD were collected from Peking University first hospital and Ruijin Hospital affiliated to the Shanghai Jiao Tong University Medical School (Supplementary Table 6). This study was approved by the Ethics Committee of Peking University Third Hospital (S2024679), Ruijin Hospital (S2020384), Renji Hospital (KY2020-180), Chinese PLA General Hospital (S2023-806-01) and Peking University first hospital (S2021-389-001).
Histological subtypes of each cancer type (DLBCL, MCL and FL) profiled in this study were established according to clinical guidelines using microscopy and immunohistochemistry and served as ground truths for assessing classification performance by trained pathologists. Cell-of-origin subtypes of DLBCL were assessed based on the Hans classifier per World Health Organization (WHO) guidelines65. For B cell lymphoma and DLBCL subtypes profiled in previous studies by RNA-seq, we relied on subtype labels from their respective resources. tFL samples were obtained during the period of morphologic transformation from FL to DLBCL. The transformation was validated through immunohistochemical staining or fluorescence in situ hybridization testing. All lymphoma specimens were re-reviewed and classified according to the WHO classification66. Samples of tFL were excluded from other analyses, except for the transformation analyses in Fig. 5, owing to their unique characteristics as an intermediate stage with high heterogeneities67. Totally, 15 samples from 6 patients with tFL were used in the analysis. Notably, three patients (tFL-1, tFL-2 and tFL-5) underwent longitudinal sampling at various time points throughout the transformation period. CRC, CRA, CHD, IBD and B cell lymphoma samples were from patients in both pre-treatment and in-treatment phases. The primary treatment strategies for patients diagnosed with DLBCL, MCL and FL were R-CHOP-like therapy, R-CHOP/R-DHAP alternating therapy and R/G-CHOP therapy (Supplementary Table 7). Specifically, the in-treatment patients with DLBCL included in our study received a variety of treatment regimens, tailored according to the individual clinical context and response to prior therapies. The majority of patients were treated with standard first-line chemotherapy regimens, such as R-CHOP or R-CHOP-like treatment. Treatment response was evaluated after two cycles of treatment according to Lugano 2014 criteria.