
Sorghum (Sorghum bicolor L. Moench) is one of the most climate-resilient and phenotypically diverse major crops; it is adapted not only to environmental stresses but also to variable agronomic practices and end-uses1,5. Commercial sorghum hybrids cultivated for the temperate regions of the Americas, Asia and Australia are typically single-purpose grain, forage or energy types2. However, open-pollinated or inbred varieties grown by small-scale producers in tropical Africa, Asia and the Americas are typically multipurpose (grain, forage and biomass).Moreover, temperate grain sorghums were bred for reduced photoperiod sensitivity7, whereas small-scale producers in the tropics grow varieties that are highly photoperiod sensitive and adapted to narrow latitudinal bands8. This diversity in and across sorghum gene pools can hinder modern breeding approaches, which rely on large homogeneous pools of elite breeding germplasm9 to develop broadly adapted improved varieties. For example, the introduction of broadly beneficial alleles into local breeding programs may alter grain characteristics or otherwise reduce the local value of a cultivar10. As an example, green revolution-style sorghum varieties, developed for North America and South Asia, were brought directly into smallholder-oriented breeding programs in Africa11. However, the ‘improved’ germplasm did not conform to local demands, which limited their adoption10. In response to these setbacks, localized participatory breeding approaches, which engage farmers and consumers, have successfully developed locally improved sorghum varieties3,4.
Despite its potential, breeding purely for locally adaptive trait combinations is not a panacea. Low-resourced breeding programs also need to leverage developments from the global research community and to share advances (for example, elite germplasm or traits) among national agricultural research systems12. These aims could be accomplished through decentralized networks of regional breeding programs. For example, local climate, cultural preferences6,13, and a priori set of variants that underlie important trait variation and co-ancestry groups14,15 can be integrated into breeding product profiles. Thus, a global pangenome resource—including a reference genome to anchor analyses, many genomes from locally adapted cultivars and whole-genome re-sequencing of global diverse germplasm—is essential to accomplish this vision. The resources and methods introduced here for sorghum not only provide valuable community assets to describe global species diversity but also establish a necessary foundation for effective trait discovery using pangenomics.
The BTx623 cultivar (PI564163) has served as the reference genotype for sorghum genetics since 2009 (ref. 16), and its 2013 V3 genome assembly17 remains the most important global reference resource for research and breeding. BTx623 is also well known as a parent line for commercial grain and bioenergy hybrids in the United States18, the first commercial hybrids in Sudan and Niger in Central and West Africa13 and as the genetic background for many trait discovery and pre-breeding resources19.
Like genome assemblies that used similar technology, the BTx623 V3 assembly contained many large gaps with unknown sequences. Long-read genome sequencing technologies enabled us to complete the repetitive regions that typically cause such gaps. Consequently, our updated BTx623 V5 genome assembly represents the 10 sorghum chromosomes with only 34 contigs (contig N50 = 50.74 Mb), a 140-fold improvement over the 4,783 contigs used to assemble V3 (Supplementary Fig. 1; see Supplementary Note 1 for methods of the unreleased V4 assembly). Similar to many recent upgrades of older genome sequences, repetitive regions in V5 are more extensive (for example, 2.86 times more contiguous centromere20 blocks), whereas the gene-rich portions are moderately improved (BUSCO genome assembly completeness scores of 98.3% for V3 and 99.7% for V5). Notably, V5 corrects several structural scaffolding errors in V3. Although many of these large misoriented regions of V3 are highly repetitive, V5 clarifies the positions of several key genes that underlie local adaptation among breeding gene pools (Supplementary Data 1 and 2), including the flowering time locus Maturity1 (ref. 7) and the biosynthesis gene POR21 for the secondary metabolite dhurrin. Linkage mapping and inference of candidate genes in these regions will be more accurate with a reference that is collinear with the recombination landscape.
As an admixed breeding line, BTx623 serves as a solid reference to anchor genome-wide genetic variation, including across our diversity panel of 1,984 unique genotypes (total n = 2,145) re-sequenced with high coverage whole-genome short-read libraries (Extended Data Fig. 1). This diversity panel spans substantial phenotypic variation (Fig. 1) for growth rate, biomass accumulation, flowering time and stress responses (Extended Data Fig. 2). It also represents many existing (for example, biomass association panel (BAP), n = 375) and new (for example, the Transportation Energy Resources from Renewable Agriculture (TERRA) panel, n = 220) populations of interest, a host of germplasm groupings (breeding, n = 500) and traditional local landrace varieties (n = 737) and 746 georeferenced genotypes with local collection coordinates (Supplementary Data 3). The diversity panel also contains members of all five of the major botanical types (n = 807 botanical assignments), which have divergent morphological traits connected to local grower preferences.
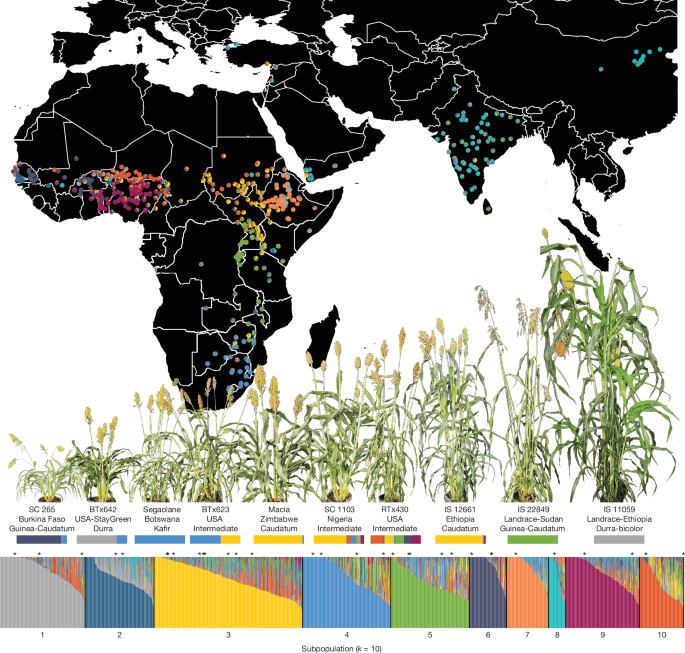
The whole-genome re-sequencing panel of 1,984 unique genotypes was clustered into 10 subpopulations (Supplementary Note 4). Ancestry proportions to each subpopulation are shown for all genotypes (vertical bars in the bar plot; bottom) and for the 693 unique African and Asian cultivars with georeferenced collection locations (pie charts and map; top). The 33 members of the pangenome reference are marked with an asterisk above the bar plot. Ten pangenome members that span the genetic and phenotypic diversity of our pangenome are labelled (including the country of origin and botanical type), with representative photographs (above the label) and their ancestry proportions (below the label).
Although the BTx623 genome forms the foundation for single-reference genomic analyses, the substantial diversity across cultivated sorghum necessitates a more comprehensive approach to genomic-enabled breeding. The recent development of multiple separately assembled genomes in many species, including sorghum22, has revealed functionally important large-scale sequence variation23 that is often not perfectly captured by short reads mapped to a single reference genome24. Multiple genomes, when integrated into a single pangenome reference, can be used to more accurately detect and annotate putative functional single-nucleotide polymorphism (SNP) or small insertion–deletion (indel) variants and are often necessary to confirm large-scale structural (SVs), copy-number (CNVs) and presence–absence variants (PAVs). This aspect is especially true in sorghum and other phenotypically diverse crops with multiple deeply diverged gene pools25. To facilitate these investigations, we generated a 33-member pangenome reference (Supplementary Tables 1 and 2 and see Supplementary Note 2 for detailed methods) that spans four genetic model genotypes: BTx623 V5; readily-transformable RTx430 (refs. 26,27); stay-green and drought tolerant BTx642 (ref. 26); and sweet Wray. We also include 9 genotypes that span the variety of our sorghum genetic diversity panel (Fig. 1 and Extended Data Figs. 1 and 2) and 20 of the most important cultivars for the global sorghum improvement community. Example cultivars include Macia and IRAT204 for breeding, CSM-63 and Mota Maradi for local adaptation, SC 35 as a stay-green line, SC 283 for tolerance to aluminium and SRN39 for resistance to the parasitic plant Striga hermonthica (hereafter referred to as striga).
We characterized phenotypic variation across the 33 reference genomes and a subset of the diversity panel by pairing standard field and physiological traits with georeferenced origin, botanical type and breeding status characteristics (Supplementary Data 4). The following field and physiological traits were analysed: (1) field-collected biomass, flowering time and plant height; (2) unmanned aerial vehicle (UAV)-collected normalized difference vegetation index (NDVI) and modified chlorophyll absorption in reflectance index (MCARI); and (3) greenhouse and image-based morphology and growth, gas exchange and water use efficiency (WUE). Combined, the reference genotypes encompass the diversity of major breeding targets such as field-based biomass accumulation and flowering time. We also noted highly diverse phenotypes across environments and conditions (Extended Data Fig. 2). For example, the lines DJOFELA and CSM-63 (cultivated and elite African breeding lines, respectively) consistently ranked highly in WUE, plant area (cm2) and height (cm) under both well-watered and water-limited conditions, which highlights their potential as broadly adaptable breeding candidates. Moreover, SRN39, another elite African line from Sudan, stood out for its strong performance under water-limited conditions, which indicated valuable drought-resilience traits. Together, this suite of phenotypes establishes a baseline for relating selection and adaptation across landscapes to plant performance.
Global pangenome sequence and gene content
Combined, the 33-member pangenome reference nearly doubles the total sequence relative to the BTx623 linear reference and includes 325 large SVs (179.6 Mb > 100 kb) and 26 >1 Mb inversions found in multiple assemblies (Fig. 2a,b and Supplementary Data 5). Outside these inversions, our sorghum genomes are collinear and lack interchromosomal translocations (for example, maize28), centromeric SVs (for example, pennycress29) or other factors that are common in plants and complicate pangenomic integration and breeding.
a, Macrosynteny map. Syntenic blocks were calculated from windowed alignments and converted to a riparian diagram. To aid visualization, all genomes were scaled to the same x axis extent; genome sizes are provided in Supplementary Table 1. b,c, Panacus (b) and OrthoFinder (c) (phylogenetically hierarchical orthogroups (OGs)) pangenome expansion curves. In both plots, core (100% presence) and PAV elements are represented by black and grey bars, respectively.
The pangenome reference also provides an opportunity to better define PAV and CNV among protein-coding genes. However, methodological considerations are crucial for interpretation30. For example, pangenomes built without independent RNA sequencing support for each genome can underestimate PAV in genes owing to a reliance on sequence similarity from related species. Conversely, differing methods, sequencing support or statistical thresholding can inflate estimates of PAV genes through an abundance of spurious false-positive gene models31. Here we sought to leverage the strengths of both approaches by first annotating all 33 members of the pangenome with deep RNA sequencing across 685 biological samples (Supplementary Data 6) and then removing rare gene models without strong support across any lines of evidence. These efforts produced a pangene set with 988,756 gene models across 54,959 phylogenetically hierarchical orthogroups (gene families; Supplementary Data 7). Most genes fell into the ‘core’ (100% presence; 691,667 or 70.0% of genes) or near-core (>90% presence; 101,316 or 10.2% of genes) PAV categories (Fig. 2c). However, some of the most important genes for domestication and ongoing crop improvement displayed PAV or CNV across the pangenome references, including the striga-resistance gene Low germination stimulant 1 (LGS1; sulfotransferase, Sobic.005G213600)32,33. Combined, variable gene content and the abundance of large-scale structural variation indicate that our representation of the sorghum pangenome may facilitate the discovery and implementation of otherwise unknown large-effect alleles.
Although pangenomes can clearly facilitate trait discovery among reference genotypes, the next step in identifying and reconstructing alleles across re-sequenced populations is both conceptually challenging and computationally intensive. Current state-of-the-art methods require reconstruction of a pangenome graph and subsequent re-alignment of all sequencing reads back to the updated graph whenever new references are included. Despite this burdensome computational overhead, graph-based genotyping effectively captures structural variation and reduces false variant calls (for example, pseudo-heterozygosity; Supplementary Note 3 and Supplementary Fig. 2) and should be considered once a stable set of reference genomes has been selected by the community. As such, a computationally lightweight and easily updatable pangenome-informed genotyping approach is needed. This problem can be tackled with allele-to-sequence dictionaries for genomic regions of interest34,35, whereby exact matches of diagnostic short sequences (here, 80 bp k-mers) are counted for each putatively causal allele. This k-mer-based genotyping approach of a priori known alleles is agnostic to the genomic complexities that can cause misalignment and false discovery of single-reference-based variants, thereby accelerating trait discovery33.
To illustrate the power of k-mer-based genotyping to detect complex structural variation, we explored SHATTERING1 (SH1), a YABBY transcription factor that causes loss-of-seed-shattering and is associated with broad geographical divergence and possibly multiple independent domestication events in sorghum36,37. Initial exploration of this locus in our pangenome graph revealed known variants that distinguish three haplotypes. The first, sh1-1 (sh1BTx623-like, Sobic.001G152901), is typical of BTx623 and represents the shortest sequence owing to a known 2,259 bp deletion relative to the undomesticated sequence. The second, sh1-2 (sh1SC 265-like, SbPI156178.01G139400), is the most common haplotype and has a putative splice modifier. And the third, sh1-3 (sh1RTx430-like, SbiRTX430.01G157400), exhibits many putatively functional36 nonsynonymous SNPs. Our exploration of these haplotypes also revealed a previously undocumented 7,856 bp insertion found only in sh1-3 and includes an identical 2,161 bp segmental duplicate (Fig. 3a). Despite substantial previous efforts to clone and explore SH1 (refs. 36,37), to our knowledge, this major insertion and untypable (through single-reference short-read alignment) exact duplicate were unknown before our de novo assembly of RTx430 and other pangenome members.
a, Simplified ‘sequence tube map’ showing only large indel variants (≥1 kb) between genomes and dot plots across the three sh1 haplotypes. Representatives of each of the haplotypes were aligned to the longest sh1-3 haplotype and 80-mer alignments are shown in the dot plots, revealing an insertion relative to sh1-1 and an exact segmental duplicate in sh1-3. The RTx430 coordinates of the SVs in the tube map are reported below the vertical dotted lines. Positions of uninformative (dark grey), non-unique (light grey) and diagnostic (larger points coloured by haplotype assignments) k-mers are shown. b, The 1,984 diversity panel re-sequencing libraries coloured by most representative (highest proportion) sh1 haplotype assignment in genome-wide principal component (PC1 and PC2) space (Extended Data Fig. 1). sh1 haplotype proportions for georeferenced African members of the diversity panel (top: pies on the map) and libraries of unique genotypes (bottom: bar chart) illustrate previously observed strong spatial and genome-wide population genetic structure.
Diagnostic k-mers that distinguished these three haplotypes were distributed across the entire interval, both at the indel breakpoints and across linked variants (Fig. 3a), which enabled us to classify all short-read re-sequencing panel members by identity to the three sh1 haplotypes. Previous work37 demonstrated that the three non-shattering alleles are most similar to functional SH1 alleles in wild sorghum populations in Tanzania (sh1-1), Nigeria (sh1-2) and Kenya (sh1-3), which led to the hypothesis that independent domestication events in these local regions produced the extant geographical structure and possible divergence among botanical types. Our assignment of the most representative sh1 allele for a set of 414 georeferenced traditional local varieties supports this claim: sh1 alleles were highly structured by both genetic subpopulation (χ216, n409 = 406.14, P < 0.001; Fig. 3b) and botanical type (χ28, n474 = 230.32, P < 0.001; Extended Data Fig. 3d). For example, sh1-1 was most abundant among Kafir botanical types (61.1%), whereas sh1-2 was most abundant among Bicolor (60.0%), Durra (89.0%) and Guinea (82.8%) types. Finally, sh1-3 was most abundant among Caudatum (68.2%) botanical types. These associations between sh1 alleles and botanical types seemed to be strongly associated with continent-wide climate variation. For example, high temperature seasonality, low April–June photosynthetically active radiation and wet warm seasons clearly distinguished sh1-1 from the two more common haplotypes (Extended Data Fig. 3d). However, the associations between sh1 alleles, genetic subpopulations and botanical types were not fixed. This finding indicates that introgression or ancient incomplete lineage sorting of sh1 alleles occurred between even the most isolated gene pools22,38 and is potentially related to local consumer and grower preference among botanical types. Therefore, additional analyses of genetic diversity as a function of gene flow and climate are needed to learn more about the history of sorghum and to detect signatures of adaptation across and in distinct sorghum gene pools.
Diversity across our pangenome reference revealed ancient divergence between sh1 haplotypes and evidence of multiple independent domestication events36,37, even though the global sorghum gene pool is only moderately differentiated (k10 subpopulation FST = 0.192; Supplementary Note 4 and Supplementary Fig. 3). This moderate population stratification probably reflects both natural selection and farmer and consumer preferences1,5 and is shaped by the complex interplay among ancient domestication alleles, local adaptation, reproductive barriers, high-diversity cultivation methods and gene flow5,39. Thus, contemporary decentralized breeding networks require a broad-based understanding of the patterns and processes that shape local adaptation and migration across the landscape.
We tested for landscape genetic signatures of adaptation, migration and gene flow by analysing spatial patterns of genetic connectivity (sharing of alleles) among 433 georeferenced African and southern Arabian cultivars through two related approaches. The first method was multilocus wavelet genetic dissimilarity40, which models allele frequency changes and identifies spatial scales at which genetic similarity is higher or lower than expected under panmixia (random mating). The second approach was estimated effective migration surfaces41,42, a graph-based method that describes spatial patterns and local rates of gene flow across the landscape at fixed spatial scales.
Both models clearly demonstrated the impact of human-mediated gene flow on sorghum diversity. For example, sorghum allelic dissimilarity deviated from panmixia at 125 km, 17 times more distant than highly structured selfing populations of wild Arabidopsis thaliana (7 km)40, but similar to that of the highly outcrossing African crop pearl millet (140 km) (Fig. 4a and Extended Data Fig. 3). Despite the pervasive outcrossing of pearl millet, allele sharing among sorghum populations exceeded pearl millet at larger and continental geographical scales, thereby demonstrating the importance of long-distance and probable human-mediated gene flow. Furthermore, effective migration surfaces of sorghum revealed local areas of low gene flow in the Ethiopian highlands and in the western and central Sahel, and continent-wide gradients along the two African continental axes that have been proposed to drive sorghum adaptive differentiation (Fig. 4b). Consistent with locally low rates of effective migration, both the Ethiopian highlands and Sahel seemed to have experienced secondary contact among domestication haplotypes (Fig. 3b) and are locations that have been previously shown to have local adaptation across steep environmental gradients in sorghum and other crops14,15,36,37.
a, Comparison of the geographical scale of allele frequency change (multilocus wavelet allelic dissimilarity) in Arabidopsis (green), sorghum (purple) and pearl millet (black). Dashed lines are mean observed differentiations, and coloured polygons indicate null (panmixia) range based on permutation tests. Geographical distance (km) is log-scaled on the x axis. As dissimilarity is not necessarily comparable among species and may be affected by sample size and marker diversity, the y axis is scaled so that the range of observations are equivalent across species (see Extended Data Fig. 3 for raw allelic dissimilarity values). b, Estimated effective migration surfaces among sorghum populations in north–south (left) and east–west (right) corridors, which have each been shown to have adaptive variation in cultivated sorghum. High gene flow (blue) and low gene flow (orange) are indicated by coloured edges in the wire-mesh graph. Graph grid resolution corresponds to cell spacing (distance between mid-points of adjacent cells) of 110 km. c, Estimated effective migration surfaces between low-drought and high-drought prevalence sorghum populations in the east–west corridor. d, Comparison of the geographical scale of allele frequency change between low-drought prevalence and high-drought prevalence sorghum populations; means of each grouping are shown in white-bordered dashed lines.
These analyses also implicate drought as a major force in historical and contemporary adaptations of sorghum2,4,43. To test the hypothesis that drought adaptation affects the geographical scale of gene flow, we binned accessions by those originating from high-drought (n = 258) and low-drought (n = 175) prevalence populations (Fig. 4c and Extended Data Fig. 3). Drought status was broadly different among admixture (k = 10) subpopulations (χ29, n431 = 82.664, P < 0.001), and we observed different patterns of allele sharing in drought classes. For example, accessions from high-drought prevalence populations had lower allelic dissimilarity than those from less drought-prone populations (Fig. 4d). This result suggests that alleles were more likely to move between spatially disjunct populations experiencing drought. This pattern was robust across the continent, with similar increases in drought-adapted allele sharing in each of the six nonoverlapping geographical regions analysed (Extended Data Fig. 3). However, migration patterns in the Sahel complicated this finding. At this location, our observation of generally lower effective migration rates persisted only among cultivars from northern, more drought-prone habitats. Conversely, effective migration among cultivars from less drought-prone southern Sahel habitats was higher than average (Fig. 4c and Extended Data Fig. 3).
The hypothesis that drought-adapted cultivars share putatively beneficial alleles across broad geographical areas can also be tested through genome-wide selection scans. Here we applied two independent but complementary approaches. First, we performed a priori tests for different ‘extended’ larger-than expected haplotypes44 between high-drought and low-drought prevalence populations in each of the six geographical regions analysed. Second, we used wavelet-based scans for loci that showed outlier patterns of spatial allele frequency change, an approach that does not use climate data. In each geographical region, the total length of extended haplotypes was not significantly different between high-drought and low-drought prevalence locations (dry = 61.8 Mb, wet = 57.4 Mb; paired t = –0.1, P > 0.1; Extended Data Fig. 4). However, extended haplotype overlap between any pair of geographical regions was greater in high-drought than low-drought prevalence accessions (total pairwise overlap: dry = 12.2 Mb, wet = 8.4 Mb; paired t = 3.8, P = 0.0013). This finding independently corroborates our previous observations of reduced allelic dissimilarity and increased effective migration rates among cultivars in high-drought prevalence regions at large spatial scales. Gene ontology enrichments of our drought-agnostic wavelet outlier scan also supported these findings. That is, despite having no climatic information, wavelet outliers at large geographical scales (800–1,200 km) were concentrated in and near drought-associated genes (Extended Data Fig. 3 and Supplementary Data 8). Individual genes included in these signatures have been previously shown to be involved in osmotic stress response45, dhurrin biosynthesis46 and lignin deposition, particularly in response to drought stress47. This finding indicates that the diversity present in our pangenome resource provides high-value targets for sorghum trait discovery and breeding. When overlaid with the pangenome reference phenome (Extended Data Fig. 2), accessions from high-drought prevalence regions corresponded to lines with increased WUE (for example, Ajabsido and CSM-63), which indicates that landscape-scale allele sharing manifests as physiological performance relevant to donor selection and crossing decisions.
Although continent-scale gradients of abiotic stress intensity have clearly shaped sorghum diversity, local agricultural productivity is often equally affected by adaptation to complex interactions among pests, pathogens and nutrient availability. Drought-adaptive and pest-adaptive responses (for example, stomatal regulation and structural leaf defence) are obvious individual targets for breeders and natural selection alike, whereas some secondary metabolites offer pleiotropic resistance to both stresses. For example, the cyanogenic glucoside dhurrin not only provides resistance to chewing insect herbivory via cyanide release48 but is also considered to improve constitutive dehydration avoidance49. As such, dhurrin is an effective bridge between physiological, biochemical and broader phenotypes such as plant vigour and WUE that influence field performance.
We first sought to define individual loci associated with the biosynthesis and catabolism of dhurrin by phenotyping members of the diversity panel for seedling dhurrin content (n = 175) and hydrogen cyanide potential (HCNp, n = 367). Contrary to expectations of a single function of dhurrin for pest defence through HCNp, the two traits were uncorrelated at the seedling stage (3–4-leaf stage; Pearson’s r = 0.075, P = 0.33) and only weakly genetically correlated later in vegetative growth (7–8-leaf stage; Pearson’s r = 0.16, P < 0.05). Accordingly, none of the strongest genome-wide association (GWAS) peaks for dhurrin (Fig. 5a) and HCNp (Extended Data Fig. 5a and Supplementary Data 9–11) were physically proximate, which potentiates a functional role of modifications in dhurrin levels outside pest defence.
a, GWAS Manhattan plot across the BTx623 V5 genome coordinate system with Wald test P values (–log10 scale) and the false-discovery rate (FDR; α = 0.05) corrected threshold for genome-wide significance. b, Zoom-in on a, highlighting the five genes of known function and the two putatively non-functional bounding genes of the BGC with a heatmap displaying LD for the 191 significant variants in the interval. Four variants that are representative of the four major LD blocks in the interval are labelled. c, Six common combinations of homozygous genotypes (BTx623 (REF) homozygote is lighter, whereas alternative (ALT) is darker) across the four major linkage blocks in the BGC; boxplots to the right of the allele map show phenotypes of plants with those genotype combinations. The proportion of exact matches across the four k-mer clusters for each of the genotype combinations are presented as coloured bars to the right (see Extended Data Fig. 5 for two additional partially linked blocks and contributions of missing and heterozygous genotypes). The reported n indicates the number of unique phenotyped re-sequenced samples with that combination of genotypes. d, The 33 pangenome references were grouped into four BGC clusters (and a ‘recombinant’ grey unclustered group for IRAT204) based on k-mer similarity. The tube map shows SVs of ≥5 kb with sequences shared across specific haplotypes (that is, nodes in the pangenome graph, open rectangles). e, The identity proportions for the four BGC clusters across all 238 georeferenced northwestern sub-Saharan Africa members of the diversity panel; colours follow d. f, The phenotypic and climatic distribution of the four BGC clusters; annual precipitation is shown only for the region highlighted in e, whereas dhurrin content is from all 175 phenotyped members of the diversity panel (colours follow d).
Dhurrin biosynthesis and transport are governed in part by a five-gene biosynthetic gene cluster (BGC) on chromosome 1 (ref. 50). Correspondingly, one of the strongest and the densest associations in our dhurrin GWAS resided in the approximately 175 kb BGC (Fig. 5b). Although the majority of significant variants were in intergenic regions, an alanine-to-valine missense mutation at 1,167,702 bp in CYP79A1 (Sobic.001G012300) was predicted to increase the binding affinity of cytochrome P450 for tyrosine, the substrate for the first committed step of dhurrin biosynthesis51 (Extended Data Fig. 5b,c). There were also several strong regulatory candidate variants, including a 2 bp CT deletion at 1,185,567 bp that disrupted predicted binding sites in an accessible chromatin region for abscisic-acid-responsive transcription factors (ABF3 and ABF4; Supplementary Table 3).
As functional sequence variation in BGCs can affect traits both directly and epistatically through modification of the pathway (for example, abundance of precursors)21, it is important to consider the BGC as a whole when designing genome-enabled approaches to improve drought and pest adaptation through dhurrin production. Consistent with the co-inheritance of, and probable correlated selection on, the BGC, we observed strong linkage disequilibrium (LD) blocks in which all but one significant variant fell into three linked clusters (Fig. 5b). These four groups of markers represented most of the unlinked variation in the region that is associated with dhurrin concentration. Combined, the total number of non-reference BTx623 alleles across these four blocks (Fig. 5c) and two additional sites with higher missing data (Extended Data Fig. 5d) were highly predictive of dhurrin concentration owing to a marginally significant additive (linear model coefficient estimate t = –2.18, P = 0.03) and highly significant quadratic (t = 4.97, P < 0.0001) effect on untransformed dhurrin levels. This observation indicates that linked epistatic interactions or other nonlinear effects between adjacent loci result in genotypic combinations with highly increased dhurrin levels.
Breeding efforts at linked loci such as the BGC must also consider the combined effects of the interval as a whole. Such an objective is ideally suited to our pangenome k-mer genotyping approach. Pangenome graph haplotype clustering revealed that 32 out of the 33 reference pangenome members fell neatly into four tight k-mer identity clusters that distinguished samples by previously typed short variants (Fig. 5c) and several previously unknown large intergenic indels (Fig. 5d). The unclustered member IRAT204 was intermediate and exhibited signatures of recombination between the ‘high’ and ‘mid’ clusters. This four-level clustering explained 3% more variance in seedling dhurrin content, a 15% better fit than the most predictive individual variant. Notably, the pangenome-based clustering revealed previously unobserved trait and climate associations. Diversity panel members with the highest proportion of k-mers diagnostic to the ‘high’ and ‘mid’ dhurrin BGC clusters produced the most dhurrin and were georeferenced to localities with lower annual precipitation (Kruskal–Wallis rank sum H = 41.01, P < 0.0001; Fig. 5e,f). This effect was even stronger at local scales, especially among samples from west Africa (H = 77.48, P < 0.0001; Fig. 5f). Thus, the BGC seems to be a metabolic hub that underlies variations in pest resistance and is probably structured by adaptation to moisture availability across continental and local geographical scales.
Expanding food security and economic prosperity under rapidly changing environmental stresses will require transformative advances in global crop improvement speed and efficacy52. Here we introduced a pangenomic resource and described our efforts to integrate pangenome-enabled variant discovery to define targets of historical environmental adaptation and to accelerate breeding decisions in sorghum. By pairing each reference genome with standardized trait data, we created a functional framework that links genomic diversity to observable agronomic performance, thereby providing species-wide biological context rather than population-level inference. The k-mer genotyping method described in this work has been applied to other complex loci with structural variation (for example, LGS1 (ref. 33) and Resistance to Melanaphis sorghi 1 (RMES1)53) and used for marker development, which illustrates both the utility of this approach and, more broadly, the value of translating patterns of diversity in pangenome references to diverse germplasm for crop improvement. In addition to better characterizing large SVs, our pangenome reference facilitates information transfer between genotypes used in breeding and those that are more amenable to laboratory experimentation. This advantage is especially important in sorghum, which is highly recalcitrant to genome-editing methods. Indeed, so far, none of the major breeding lines can be efficiently edited and only two genotypes (RTx430 and P898012) are considered readily transformable without morphogenic regulator technology. Our pangenome resource bridges this gap by effectively reconstructing the putative functional alleles in breeding pedigrees and the orthologous sequence to target in transformable varieties. Consequently, it will pave the way for accelerated pangenome-enabled traditional breeding and genome editing of locally adapted alleles across global sorghum germplasm.
Plant material preparation and nucleic acid extractions
Young seedlings were grown in flat pans under healthy, pest-free and disease-free conditions until the first fully developed leaves emerged. To optimize DNA yield and quality, seedlings were dark-treated for 24–30 h under moist conditions. Tissue was collected by hand in small batches, cutting half an inch above the soil surface and immediately flash-freezing in liquid nitrogen within 1 min of excision. Approximately 50 g of tissue was collected in this manner, stored in pre-labelled freezer-quality ziplock bags at –80 °C and kept frozen until extraction. DNA was extracted from young tissue using a previously published protocol54 with minor modifications. Flash-frozen young leaves were ground to a fine powder in a frozen mortar with liquid nitrogen followed by gentle extraction in 2% CTAB buffer (including proteinase K, PVP-40 and β-mercaptoethanol) for 30 min to 1 h at 50 °C. After centrifugation, the supernatant was gently extracted twice with 24:1 chloroform and isoamyl alcohol. The aqueous phase was transferred to a new tube and one-tenth volume 3 M sodium acetate was added, gently mixed and DNA was precipitated with isopropanol. DNA precipitate was collected by centrifugation, washed with 70% ethanol, air dried for 5–10 min and dissolved thoroughly in an elution buffer at room temperature followed by RNAse treatment. DNA purity was measured with Nanodrop, and the DNA concentration was measured using a Qubit HS kit (Invitrogen). DNA size was validated using a Femto Pulse system (Agilent).
We also grew three biological replicates of the reference genotypes (see Supplementary Data 12 for phenotype data and Supplementary Data 13 for original photographs without the backgrounds removed) and sampled them at key developmental stages and organ types for transcriptome assembly and genome annotation (sample and data collection were performed by the team at Donald Danforth Plant Science Center in 2020). For the 29 diverse pangenome reference members and BTx623 (excluding, BTx642, Wray and RTx430), tissues were collected from greenhouse-grown sorghum plants maintained under controlled environmental conditions. For each replicate, tissues from multiple plants were pooled when individual tissue quantity was insufficient. Six tissue types were represented in the samples. (1) Approximately half-inch sections of stem tissue were excised from each internode and nodal region of the same stem at 60 days after planting (DAP), immediately frozen in liquid nitrogen and pooled to generate composite stem samples. (2) At 28 DAP, the youngest fully expanded leaf was collected and subdivided into tip, base, midrib and sheath segments, which were pooled to represent the composite leaf sample. (3) Entire primary and crown root systems were harvested at 28 DAP, gently rinsed with water to remove adhering soil and pooled per replicate. (4) Developing inflorescences were collected at both heading and anthesis to capture pre-pollination and post-pollination reproductive stages. Whole inflorescences were excised, flash-frozen and pooled across plants. (5) Developing grain was sampled at 5 DAP, 20 DAP and at the black layer stage to represent early, mid and late seed development, respectively. (6) Whole seedlings were collected at 12 DAP under well-watered (100% field capacity (FC)) and water-stressed (45% FC) conditions. Water stress was initiated 5 DAP, and both shoot and root tissues were harvested and pooled at 12 DAP. In addition to these developmental-stage collections, time-course sampling was conducted for two representative genotypes, PI660565 and PI276816, to capture early vegetative dynamics. For each line, three biological replicates were collected at 10, 17, 21, 25 and 31 DAP. At each time point, leaf and stem tissues were collected following the same procedures described above. Immediately after collection, all tissues were flash-frozen in liquid nitrogen and stored at –80 °C until RNA extraction. Tissue collection for Wray and for BTx642 and RTx430 (as previously detailed26) generally followed the above protocol, but with some differences in the types of tissues.
Long-read sequencing technology, as used in the construction of our pangenome reference assemblies, has improved the resolution of repetitive regions and closed gaps in other complex genomes55,56. Although the quality and contiguity of our pangenome assemblies are consistent, the input data depth, sequencing technology, bioinformatic methods available and sequencing read characteristics necessitated some differences in computational genome assembly strategy. Here we provide a summary of the basic methods (see Supplementary Note 2 for a full description of genome assembly methods for each reference genome).
The majority of the pangenome sequences were generated by assembling PACBIO CLR reads with CANU (v.1.8)57, whereas five accessions (PI156178, RTx430, BTx642 and PI565121) were assembled with MECAT (v.1.4)58, and one accession (Wray) was generated using PACBIO HiFi data assembled with HiFiAsm+HIC (v.16.1)59. All sequencing was conducted at the HudsonAlpha Institute for Biotechnology and the Department of Energy (DOE) Joint Genome Institute. All assemblies were subsequently polished using ARROW (v.2.1)60, except BTx623 and Wray, which were polished using RACON (v.1.14)61. A combination of 32,400 syntenic markers (unique, non-repetitive, nonoverlapping 1.0-kb sequences from BTx642) and 12,641 annotated genes from BTx623 were used to identify misjoins in the assembly. Contigs were then ordered, oriented and assembled into ten chromosomes after examining syntenic marker and gene alignment positions on the polished assemblies. Each chromosome join was padded with 10,000 Ns. Contigs terminating in significant telomeric sequence were identified using the (TTTAGGG)n repeat, and care was taken to make sure that they were properly oriented in the production assembly. Chromosomes were numbered using BTx623 V3 naming convention. The remaining scaffolds were screened against bacterial proteins, organelle sequences, and GenBank non-redundant datasets and removed if found to be a contaminant. Chloroplast and mitochondrial genomes were generated using the OatK pipeline (v.1.0)62. Homozygous SNPs and indels were corrected to match the consensus call from Illumina fragment reads (2 × 150, 400 bp insert) by aligning the reads using bwa-mem (v.0.7.17-r1188)63 and identifying homozygous SNPs and indels with the UnifiedGenotyper tool in GATK (v.3.6-0-g89b7209)64.
Genome annotation was performed using the pipeline developed by the DOE Joint Genome Institute and Phytozome65. As methodological considerations can substantially affect estimates of protein-coding gene PAVs30, each pangenome member underwent two rounds of gene prediction. In the first round, gene models were independently predicted for each genome followed by the propagation of these predictions across the entire pangenome in the second round.
In the initial round, transcript assemblies were generated from 2 × 150 bp stranded paired-end Illumina RNA sequencing reads (Supplementary Table 2) using PERTRAN (as previously described in detail66) for genome-guided assembly via GSNAP (v.2013-09-30)67, followed by splice graph construction, alignment validation and correction. PacBio Iso-Seq CCS reads, when available, were corrected and collapsed using a GMAP-based pipeline67 to refine alignments, correct splice junctions and cluster alignments when their intron (or introns) matches if spliced or 95% similar if it was a single exon. Final transcript assemblies were produced using PASA (v.2.0.2)68, integrating RNA sequencing assemblies, corrected CCS reads and Sanger ESTs. A species-specific repeat library was built from BTx623 V3 using RepeatModeler (v.open1.0.11)69. Repeats were functionally analysed with InterProScan (v.5.47-82.0)70, incorporating Pfam71 and PANTHER72 databases, and those with significant hits to protein-coding domains were excluded. Genomes were soft-masked using RepeatMasker (v.open1.0.11)69 with the curated repeat library. Gene loci were identified using transcript assembly and EXONERATE (v.2.4.0)73 alignments of proteins from Arabidopsis, soybean, poplar, Aquilegia, grape, rice, Setaria viridis, Brachypodium, Panicum hallii, pineapple, Acorus americanus and Swiss-Prot (2020_06) to the repeat soft-masked genomes, with up to 2,000-bp extension on both ends unless extending into another locus on the same strand. Gene models were predicted using FGENESH+ (v.3.1.0)74, FGENESH_EST, EXONERATE, PASA assembly ORFs and AUGUSTUS (v.3.1.0)75 trained on high-confidence PASA assembly open reading frames with intron hints from RNA sequencing alignments. Candidate models were selected based on EST and protein support and penalized for repeat overlaps. PASA refinement added UTRs, corrected splicing and incorporated alternative isoforms. Cscore (BLASTP score ratio and protein coverage) was computed for PASA-refined proteins. Transcripts were retained if Cscore and coverage was ≥0.5 or supported by ESTs; those with >20% CDS-repeat overlap required a Cscore ≥ 0.9 and ≥ 70% coverage. Models with >30% TE domain overlap (Pfam) were excluded.
In the second round, each genome was hard-masked with its high-confidence gene models (supported by transcriptome and homology evidence). BLASTX and EXONERATE were used to predict new gene models by projecting high-confidence models from other pangenome members onto the hard-masked assemblies. Predicted models were retained if they showed stronger homology support than existing models and were not contradicted by transcript evidence, or if no first-round model existed at that locus. Incomplete gene models, which had low homology support without full transcriptome support, or short single exon genes (<300 bp CDS) without protein domain or good expression were manually excluded.
A pangenome graph was constructed for each chromosome using Minigraph-Cactus and default settings (v.2.9.3)76 with the BTx623 V5 genome as the primary reference. Clipped chromosome graphs were merged and prepared for visualization using vg (v.1.59.0)77. We used ODGI (v.0.9.0)78 to inspect representation of each genome across the graph and sequenceTubeMap (v.0.1.0)79 to visualize variation in genomic regions of interest. For the dhurrin BGC and SH1 loci, we further processed this graph with vg and vcfwave (vcflib v.1.0.10)80 to reduce allelic complexity and retain only variants ≥5 kb and ≥1 kb in length, respectively.
Gene families were calculated with OrthoFinder (v.2.5.5)81 and parsed with GENESPACE (v.1.3.1)82 to create saturation curves. Synteny maps were created using DEEPSPACE (v.0.1.0, github.com/jtlovell/DEEPSPACE), which aligns and tracks the positions of windowed sequence alignments and quickly visualizes large-scale SVs. SyRI (v1.6.3)83 was used for pairwise variant detection from whole-genome alignments via minimap2 (v.2.22-r1101)84. Pangenome graph saturation curves were calculated with Panacus85.
A total of 2,145 diversity samples (n = 1,984 unique genotypes + redundant + polishing) were re-sequenced at a median coverage of 43.39× (range 1.96–364.18) (Supplementary Data 3). The samples were sequenced using Illumina HiSeq X10 and Illumina NovaSeq 6000 paired-end sequencing (2 × 150 bp) at the HudsonAlpha Institute for Biotechnology and the Joint Genome Institute. To account for different library sizes, reads were downsampled to ≤50× coverage.