
PIEZO2 is a mechanotransduction channel that mediates an array of physiological processes in vertebrates, including touch6, proprioception8 and respiration9. Pathogenic loss- or gain-of-function mutations in this channel can cause extensive mechanosensory defects or debilitating neurological diseases such as Gordon syndrome, Marden–Walker syndrome or distal arthrogryposis type 5 (ref. 10). Despite recent advances in understanding the physiological roles of PIEZO2, the underlying structural correlates of function remain poorly understood.
PIEZO1 and PIEZO2 are homotrimeric membrane proteins with three identical subunits that assemble to form a triskelion11 (Fig. 1a). Each subunit has a blade of 36 transmembrane domains extending outward and upward from a central C-terminal pore domain, forming a concave shape around 24 nm in diameter in membrane-free structural models12,13,14,15. The blades are proposed to function as the primary sensors of mechanical force because they directly connect to the ion-conducting pore and, in the case of PIEZO1, blade expansion by membrane tension correlates with channel activation16,17,18. Mechanosensitive ion channels are generally gated through either a ‘force from lipid’ mechanism driven by membrane tension, a ‘force from filament’ mechanism involving force transmission through cytoskeletal tethers, or a hybrid of the two19. While membrane tension has been established as the primary gating stimulus for PIEZO12,12,20,21, comparatively little is known about how PIEZO2 is gated by physiologically relevant forces.
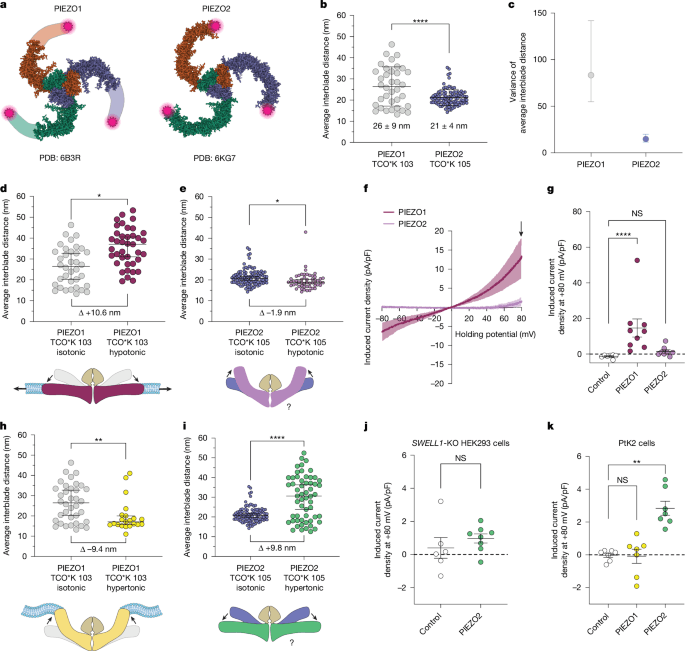
a, Structural models of PIEZO1 and PIEZO2, showing the tag positions (magenta stars). b, Interblade distances for mouse PIEZO1 tagged at residue 103 (grey; n = 36 molecules, n = 4 cells) and PIEZO2 tagged at residue 105 (blue; n = 52 molecules, n = 4 cells) in unstimulated PtK2 cells. Kolmogorov–Smirnov test, ****P = 6.3 × 10⁻⁵, D = 0.44. c, The variance and 95% confidence intervals (CI) of the mean interblade distances in b. F test of equality of variances, P = 8.5 × 10⁻⁸, F = 5.6. d, PIEZO1 interblade distances from expansive membrane stretch (red; median = 34.7 nm; n = 41 molecules, n = 3 cells) versus unstimulated (grey; median = 26.5 nm). Kolmogorov–Smirnov test, *P = 0.01, D = 0.38. e, PIEZO2 during expansive membrane stretch (magenta; median: 18.9 nm; n = 53 molecules, n = 3 cells) versus unstimulated (blue; median = 19.9 nm). Kolmogorov–Smirnov test, *P = 0.01, D = 0.26. f, Current–voltage curves of hypo-osmotic-swelling-evoked current density for PIEZO1 (n = 9 cells) and PIEZO2 (n = 8 cells) in SWELL1-KO HEK293 cells. The arrow denotes the current at +80 mV, used for quantification. g, Peak stretch-induced current density at +80 mV for f, including untransfected controls (n = 7 cells). Kruskal–Wallis test with Dunn’s post hoc test, ****P = 6.2 × 10⁻⁵. h, PIEZO1 interblade distances from hyperosmotic stimulus (yellow; median = 19.8 nm; n = 21 molecules, n = 3 cells) versus unstimulated (grey). Kolmogorov–Smirnov test, **P = 0.008, D = 0.46. i, PIEZO2 during hyperosmotic stimulus (green; median = 30.6 nm; n = 57 molecules, n = 3 cells). Kolmogorov–Smirnov test; ****P = 1.3 × 10⁻⁹, D = 0.54. j, Peak stretch-induced current from hyperosmotic stimulus in SWELL1-KO HEK293 cells expressing PIEZO2 (n = 8 cells) and untransfected controls (n = 6 cells). Mann–Whitney U-test, P = 0.181. k, The peak induced current density from hyperosmotic stimulus in PtK2 control cells (n = 6 cells) versus cells expressing PIEZO1 or PIEZO2 (n = 7 cells each). Kruskal–Wallis test, **P = 0.001. Data are mean ± s.d. (b), median ± 95% CI (d, e, h and i) and mean ± s.e.m. (f, g, j and k). All statistical tests were two-sided.
PIEZO1 and PIEZO2 have distinct roles in physiology. While PIEZO1 is predominantly expressed in non-neuronal cells, such as erythrocytes22 and chondrocytes23, PIEZO2 is primarily expressed in somatosensory neurons6, such as those that mediate proprioception and touch. These divergent physiological roles are consistent with their distinct functional properties. PIEZO1 is primarily activated by membrane tension, but PIEZO2 is preferentially activated by cellular indentation4, the mode of stimulus that many cutaneous mechanosensory neurons are tuned to detect24. Indentation stimuli, for example by poking a cell with a blunt probe, apply a localized force that both deforms the membrane and strains the underlying cytoskeleton25. By contrast, techniques like cell-attached pressure clamp recordings expand the membrane like a balloon and produce relatively uniform lateral membrane tension25. Comparing the responses of mechanotransduction channels to each of these stimulus modalities can provide clues about their gating mechanism. Notably, atomic-force-microscopy experiments show that PIEZO2 is approximately threefold more sensitive to indentation compared with PIEZO1 in heterologous cells5 yet, paradoxically, PIEZO2 is equally less sensitive to membrane tension in cell-attached or excised patch recordings26. Moreover, only a small minority of PIEZO2-transfected cells exhibits mechanosensitive currents in cell-attached recordings, and these currents are consistently small4,27. These observations suggest that PIEZO2 might not be gated purely through a force-from-lipid mechanism. Despite these clear differences in function, the cryo-electron microscopy (cryo-EM) structures of each channel are highly similar (Fig. 1a) and provide few clues about their functional specialization, highlighting the need to investigate their structural mechanics in a cellular context.
To compare the structural mechanics of PIEZO1 and PIEZO2, we combined MINFLUX fluorescence nanoscopy with fluorogenic DNA PAINT to measure the conformation of individual molecules in a cell membrane. We previously used MINFLUX to measure the conformational states of PIEZO1 using conjugated spontaneously photoblinking dyes16; however, these dyes irreversibly bleach on excitation and produce variable photon counts. To increase the photon yield per molecular position, we used DNA PAINT, which exploits transient binding of fluorophore-labelled oligonucleotides28. Programmable binding kinetics through sequence design and the use of more stable dyes can yield far more localization events per molecule, which in turn can resolve a molecular position with higher confidence. We chose Potorous tridactylus kidney (PtK2) cells for imaging because they have an exceptionally flat morphology29 that allows imaging probes to easily reach molecules on the apical membrane adjacent to the coverslip. This minimizes optical aberrations, eliminates the complication of restricted diffusion of probes between the basal membrane and the coverslip and removes the need for permeabilization, which could otherwise expose intracellular channels that are not functionally active.
Using genetic code expansion, the click chemistry substrate trans-cyclooctene-lysine (TCO*K) was incorporated into equivalent extracellular loops of the distal blade in PIEZO1 and PIEZO2 (Methods). These sites were labelled with a tetrazine-conjugated DNA oligonucleotide that served as a transient docking site for a complementary oligonucleotide conjugated to the fluorescent dye ATTO 643 freely diffusing in the imaging buffer (Extended Data Fig. 1a). The cells were fixed in an isosmotic cross-linking solution to preserve morphology and imaged without permeabilization to keep the plasma membrane intact. Conventional DNA PAINT is hindered by background from unbound fluorophores, so we used self-quenching fluorogenic imager probes with ATTO 643 and an IowaBlack fluorescence quencher on opposite termini that become unquenched when bound to a docking strand30. Under identical imaging conditions, fluorogenic DNA PAINT yielded lower background, higher localization precision and more detections per binding event (Extended Data Fig. 1b–d). We verified that fluorogenic DNA-PAINT did not introduce measurable bias in MINFLUX localizations due to quencher–fluorophore interactions, and that we maintained nanometre-scale stability over extended acquisitions (Extended Data Fig. 2). Raw localizations were clustered and fit with three-dimensional (3D) Gaussian mixture models to obtain precise fluorophore positions, enabling us to directly measure 3D distances between the distal blade domains of individual PIEZO channels (Methods). The resulting enhanced localization density, especially compared with traditional photoblinking dyes16, enabled us to apply more stringent parameters in our 3D clustering algorithm (Methods and Extended Data Fig. 3), increasing confidence that each cluster corresponds to a single PIEZO protomer.
Compared with PIEZO1, the blades of PIEZO2 are significantly less expanded in the absence of stimulation (Fig. 1b). Notably, while thermal fluctuations alone are thought to cause large deformations in the shape of PIEZO116,17, the markedly narrower range of conformational states in PIEZO2 also reveals that the blade domains are much more conformationally rigid than PIEZO1 (Fig. 1c). If blade expansion generally correlates with activation, the larger force required to gate PIEZO2 in excised membrane patches26 might reflect the extra energy required to bend the more rigid blades by the same distance. These differences in flexibility might also explain why the distal blades of PIEZO2 were resolved by cryo-EM but were not for PIEZO112,14.
The primary gating stimulus for PIEZO1 is membrane tension2,12,20,21. Expansive membrane stretch from osmotic swelling increases tension31, similarly to cell-attached pressure clamp recordings25. To isolate PIEZO-mediated currents, we used SWELL1-knockout (KO) HEK293 cells, which lack the ubiquitous SWELL1-dependent chloride current evoked by hypotonic stimuli that otherwise obscures the measurements of mechanosensitive cation channels16. We replicated our previous findings16, and show that membrane tension from osmotic swelling expands the blades of PIEZO1 (Fig. 1d) and gates the channel (Fig. 1f). This behaviour is well explained by a force-from-lipids model, whereby mechanical energy from the bilayer is transmitted directly to the channel without requiring intermediary components19. Notably, osmotic swelling significantly compacted the blade domains of PIEZO2 by 1.9 nm on average (Fig. 1e) and did not significantly activate the channel (Fig. 1f,g). This lack of activation appears consistent with cell-attached pressure-clamp recordings in heterologous cells, in which only a small minority of cells expressing PIEZO2 displays mechanosensitive currents, and those with responses are invariably small4,27. These distinct gating properties indicate that PIEZO2 does not follow a strict force-from-lipids mechanism and may instead recruit additional cellular components that alter how force is transmitted to the channel.
The mismatch in curvature between the concave PIEZO1 structure and planar lipid bilayer results in a bending stress that can substantially expand the blades without externally applied tension16,17. A hypertonic extracellular environment reduces cell volume and causes plasma membrane slackening and folding32. Consequently, the blades should compact as residual tension is relieved and as the channel partitions into membrane folds matching its intrinsic curvature. While we observed this effect for PIEZO1 (Fig. 1h), we found that the blade domains of PIEZO2 are significantly expanded by the same stimulus (Fig. 1i). This raises the question of how a stimulus that reduces membrane tension can expand the blades of PIEZO2. In addition to slackening, hyperosmotic shrinkage is thought to fold slack membrane into the gaps of the comparably rigid cortical actin meshwork32. If PIEZO2 is tightly coupled to actin, we hypothesize that this might recruit a membrane bending force that expands the blade domains. Consistent with this idea, a hypertonic stimulus does not significantly activate PIEZO2 in SWELL1-KO HEK293 cells (Fig. 1j), but it does activate the channel in PtK2 cells (Fig. 1k), of which the actin cortex is roughly one order of magnitude stiffer33,34 and more tightly anchored to the plasma membrane35. Together, these data favour a tether-coupled membrane gating model for PIEZO2, whereby deformation of the membrane relative to a connection to actin can apply a gating force to the channel (Fig. 2a).
a, Tether-coupled gating model: changes in membrane properties (for example, curvature) relative to a cytoskeletal tether exert force on the blade domains. b, Cytochalasin D (CytoD) decreases the resting PIEZO2 interblade distance (dark blue; median = 20.1 nm; n = 51 molecules, n = 3 cells; Kolmogorov–Smirnov test, ****P = 3.4 × 10⁻⁵, D = 0.40) and permits blade expansion from expansive membrane stretch (green; median = 28.3 nm; n = 24 molecules, n = 5 cells; Kolmogorov–Smirnov test, ***P = 0.0002, D = 0.53). c, CytoD enables stretch-evoked PIEZO2 activation in SWELL1-KO HEK293 cells. n = 5 (control), n = 7 (PIEZO2) and n = 5 (PIEZO2 + CytoD) cells. Kruskal–Wallis test, *P = 0.048. d, Schematic of PIEZO2 blade expansion after actin disruption. e, PIEZO2(ΔIDR5) shows reduced interblade distance at rest (light blue; median = 16.6 nm; n = 30 molecules, n = 4 cells; Kolmogorov–Smirnov test, ****P = 9.7 × 10⁻⁶, D = 0.57) and robust expansion from hypo-osmotic swelling (orange; median = 37.2 nm; n = 21 molecules, n = 6 cells; Kolmogorov–Smirnov test, ****P = 3.9 × 10⁻⁷, D = 0.79). f, Hypo-osmotic swelling gates PIEZO2(ΔIDR5) in SWELL1-KO cells. n = 5 (control), n = 10 (PIEZO2) and n = 4 (PIEZO2(ΔIDR5)). Kruskal–Wallis test, *P = 0.011. g, Schematic of PIEZO2(ΔIDR5) blade expansion from expansive membrane stretch. h, Overlaid MINFLUX single-molecule trajectories aligned by centre of mass (≥1 s) (top). Bottom, MSD analysis for trajectories with ≥200 localizations. Trajectories (grey) were averaged (50 bins in 350 ms; black circles) and fit at 5–50 ms (cyan, microscopic D: PIEZO1 = 0.0218, PIEZO2 = 0.0096, PIEZO2(ΔIDR5) = 0.0264 µm2 s−1) and 50–350 ms (magenta, macroscopic D: PIEZO1 = 0.0197, PIEZO2 = 0.0041, PIEZO2(ΔIDR5) = 0.0149 µm2 s−1). n = 55 (PIEZO1), n = 61 (PIEZO2) and n = 36 (PIEZO2(ΔIDR5)) trajectories. i, Diffusion coefficients from individual trajectories in h. Top, microscopic D for PIEZO2 (blue; median = 0.011 µm2 s−1), PIEZO1 (grey; median = 0.024 µm2 s−1) and PIEZO2 ΔIDR5 (dark blue; median = 0.032 µm2 s−1). Kruskal–Wallis test, ****P = 3.8 × 10⁻⁹ (PIEZO1 versus PIEZO2), ****P = 1.3 × 10⁻¹⁴ (PIEZO2 versus PIEZO2(ΔIDR5)). n = 104 (PIEZO1), n = 87 (PIEZO2) and n = 65 (PIEZO2(ΔIDR5)) trajectories. Bottom, macroscopic D for PIEZO2 (blue circles; median = 0.011 µm2 s−1), PIEZO1 (grey; median = 0.024 µm2 s−1) and PIEZO2(ΔIDR5) (dark blue; median = 0.036 µm2 s−1). Kruskal–Wallis test, **P = 0.0023, ****P = 1.2 × 10⁻⁹. n = 55 (PIEZO1), n = 61 (PIEZO2) and n = 36 (PIEZO2(ΔIDR5)) trajectories. Data are mean ± s.e.m. (c, f and h) and median ± 95% CI (b, e and i). All statistical tests are two-sided. The diagrams in a, d and g were created using BioRender; Mulhall, E. M. https://BioRender.com/5k5114d (2026).
If actin tethering controls how force is transmitted to PIEZO2, then destabilizing the actin cytoskeleton should revert the channel to a force-from-lipids mechanism of gating, consistent with its close structural similarity to PIEZO1 (Fig. 2d). Indeed, when cells were treated with the actin-destabilizing drug cytochalasin D, expansive membrane stretch from osmotic swelling significantly expanded the blades of PIEZO2 and activated the channel (Fig. 2b,c). This could explain why pressure-evoked PIEZO2 currents recorded in cell-attached recordings become larger in magnitude and more frequent after treatment with actin-disrupting compounds4. Notably, the unstimulated conformation of PIEZO2 significantly decreased under these conditions but had no measurable effect on the conformation PIEZO1, suggesting that specific tethering of PIEZO2 to actin is responsible for a resting state of blade expansion (Fig. 2b and Extended Data Fig. 4). The significantly smaller distribution of conformational states compared with PIEZO1 in the same conditions also implies that the relative rigidity of PIEZO2 is an intrinsic property of the channel rather than a result of mechanical coupling to actin.
Previous work has implicated the intrinsically disordered intracellular domain between transmembrane helices 12 and 13 (IDR5) in PIEZO2 in activation by indentation forces, and this domain was hypothesized to be involved with a connection to the actin cortex4 (Fig. 2g). We found that, like actin disruption, deletion of the IDR5 domain in PIEZO2 (PIEZO2(ΔIDR5)) decreased the resting state of expansion of the channel, and expansive membrane stretch from osmotic swelling significantly expanded the blades and activated the channel (Fig. 2e,f). If PIEZO2 does scaffold to actin, we also reasoned that the channel should be immobilized in the cell membrane and that disruption of this connection should increase its mobility. To test this, we performed single-molecule 3D MINFLUX tracking in live cells expressing PIEZO proteins tagged at the C terminus with a HaloTag and labelled with a Janelia Fluor 635 HaloTag ligand positioned near the channel’s centre of mass. We ensured that only individual molecules were tracked by exploiting the roughly quantal photon emission intensity pattern to isolate single emitters resident in the plasma membrane (Methods and Extended Data Fig. 5a,b). Single-molecule trajectories were reconstructed from 3D MINFLUX localizations and diffusion coefficients were obtained by weighted fits of mean-squared displacement (MSD) versus time (Methods). We found that PIEZO1 freely diffuses with a median diffusion coefficient of D = 0.02 µm2 s−1 (Fig. 2h), consistent with independent measurements of PIEZO1 diffusion in red blood cells36, neural stem cells37 and fibroblasts38. By contrast, PIEZO2 is significantly more immobilized than PIEZO1 (median D = 0.004 µm2 s−1) (Fig. 2h). Analysis of microscopic diffusion during the first 50 ms of the trajectories, before the channel will tend to interact with diffusional barriers created by membrane–cytoskeletal interactions36, shows that diffusion is restricted essentially from the outset of measuring its motion (Fig. 2i (top)), indicative of a strong tethering interaction.
Compared with the wild-type channel, PIEZO2(ΔIDR5) showed markedly increased mobility (Fig. 2h,i), suggesting that the interaction responsible for immobilization is abolished when IDR5 is removed. Notably, these data differ from an earlier study reporting no change in diffusion after deletion of PIEZO2 IDR54. This discrepancy probably arises from the use of 2D TIRF single-particle tracking on densely labelled channels, which cannot reliably resolve individual molecules nor discriminate those in the plasma membrane from intracellular pools in the secretory pathway. Substitution of PIEZO2 IDR5 into the corresponding intracellular loop of PIEZO1 did not alter the diffusion properties relative to wild-type PIEZO1 (Extended Data Fig. 5c). This implies that the IDR5 domain alone is not sufficient to confer tethering, and that additional PIEZO2-specific elements are required for immobilization. Overall, these findings demonstrate that actin-dependent immobilization of PIEZO2 modifies how force is conveyed to the channel, and that IDR5 is necessary but not sufficient by itself for this interaction.
As IDR5 does not possess a canonical actin-binding motif, and most anchored membrane proteins such as integrins, cadherins or ion channels rely on intermediate adaptors to couple to actin39, we hypothesized that PIEZO2 tethers to actin through an intermediate protein that binds at least partially to IDR5. To identify candidate tethers, we used protein cross-linking and mass spectrometry (MS)-based proteomics (Fig. 3a). We compared the abundance ratio of proteins that cross-linked to either PIEZO2 or PIEZO2(ΔIDR5) and identified candidates that are known to mediate interactions between actin and membrane proteins (Fig. 3b). As disruption of the connection to actin is expected to render PIEZO2 sensitive to expansive membrane stretch, we next performed a small interfering RNA (siRNA) knockdown screen targeting mRNAs of candidate tethering proteins and measured PIEZO2 responses to osmotic swelling. We found that only knockdown of FLNB, an actin-binding scaffold protein that binds to cortical actin filaments and anchors membrane proteins to the cytoskeleton40, elicited significant stretch responses from PIEZO2 (Fig. 3c). Notably, knockdown of the closely related family member FLNA had no effect on stretch responses. We next made CRISPR-mediated clonal FLNB-knockout cells on the SWELL1-KO HEK293 background to confirm that the effects seen with siRNA knockdown are indeed due to loss of FLNB (Extended Data Fig. 6). PIEZO2 in these cells showed significant responses to expansive membrane stretch in all cells tested (Fig. 3d), suggesting that FLNB is a component of the molecular tether that confers force selectivity to PIEZO2.
a, The cross-linking MS workflow. LC, liquid chromatography. b, The exponentially modified protein abundance index (emPAI) ratio of proteins cross-linked to PIEZO2 versus PIEZO2(ΔIDR5). Candidate cytoskeletal–membrane tethers highlighted (magenta). c, Stretch-induced current in SWELL1-KO HEK293 cells expressing PIEZO2 with non-targeting siRNA (n = 46), FLNB siRNA (n = 24) or other candidate siRNAs (VINC (n = 7), MOES (n = 11), CTNB1 (n = 10), FLNA (n = 9) and TAGL2 (n = 11)). d, Stretch-induced current in SWELL1-KO HEK293 cells electroporated with scrambled CRISPR sgRNA (untransfected or expressing PIEZO2; n = 4 cells each) compared with clonal SWELL1-KO/FLNB-KO cells (untransfected (n = 4) or expressing PIEZO2 (n = 8)). Mann–Whitney U-test, **P = 0.004. e, The PIEZO2 interblade distance in WT PtK2 cells (blue; median = 18.0 nm; n = 30 molecules, n = 4 cells) versus PtK2 cells with Potoroo Flnb DsiRNA (cyan; median = 16.8 nm; n = 41 molecules, n = 3 cells; Kolmogorov–Smirnov test, ****P = 4.5 × 10⁻⁷, D = 0.79) versus PtK2 cells with Flnb DsiRNA + hypo-osmotic swelling (purple; median = 37.0 nm; n = 39 molecules, n = 3 cells; Kolmogorov–Smirnov test, ****P = 3.2 × 10⁻¹⁰, D = 0.51). f, Schematic of expansive stretch without FLNB. g, MINFLUX tracking MSD fits: 5–50 ms (cyan, PIEZO2 + non-targeting DsiRNA: D = 0.0106 µm2 s−1; PIEZO2 + Flnb DsiRNA: D = 0.0181 µm2 s−1) and 50–350 ms (magenta, PIEZO2 + non-targeting DsiRNA: D = 0.00495 µm2 s−1; PIEZO2 + Flnb DsiRNA: D = 0.0090 µm2 s−1). n = 55 (PIEZO1), n = 61 (PIEZO2), n = 81 (PIEZO2 Flnb DsiRNA) and n = 50 (PIEZO2 NT DsiRNA) trajectories. h, Microscopic D from individual trajectories. n = 104 (PIEZO1), n = 87(PIEZO2), n = 126 (PIEZO2 Flnb DsiRNA) and n = 138 (PIEZO2 + non-targeting DsiRNA) trajectories. Kruskal–Wallis test, ****P = 2.1 × 10⁻¹⁰. i, Macroscopic D from individual trajectories. n = 55(PIEZO1), n = 61 (PIEZO2), n = 81 (PIEZO2 Flnb DsiRNA) and n = 50 (PIEZO2 non-targeting DsiRNA) trajectories. Kruskal–Wallis test, *P = 0.0183. j, Indentation-evoked current in SWELL1-KO cells. n = 26 (PIEZO2), n = 7 (PIEZO2(ΔIDR5)) and n = 20 (PIEZO2 FLNB KO) cells. k, The indentation threshold for macroscopic current from j. Kruskal–Wallis test, *P = 0.0214, ***P = 0.0002. The box plots show the median (centre line), interquartile range (box limits, 25th–75th percentiles) and the minimum and maximum values (whiskers). l, Measured PIEZO2 blade conformation relative to cryo-EM (18.04 nm). For PIEZO2 + latrunculin A, median = 16.9 nm; n = 18 molecules, n = 4 cells; other values and n are described in Figs. 1b, 2b,e and 3e. Data are mean ± s.e.m. (c, d, g, j and k) and median ± 95% CI (e, h, i and l). All statistical tests were two-sided. The diagrams in a and f were created using BioRender; Mulhall, E. M. https://BioRender.com/5k5114d (2026).
We next assessed conformational changes of PIEZO2 in the absence of FLNB using MINFLUX. As the P. tridactylus genome remains unsequenced and 21-nucleotide siRNAs produced only partial knockdown in SWELL1-KO HEK293 cells after 48 h, we instead used 27-nucleotide double-stranded Dicer-substrate siRNAs (DsiRNAs), which can be up to 100-fold more potent than the corresponding 21-nucleotide single-stranded siRNAs41. We transfected four arrayed DsiRNAs against the mRNA encoding Potoroo Flnb—designed using the published PtK2 cell transcriptome as a ref. 42—twice over a five-day period to obtain robust knockdown before imaging. Like actin disruption and deletion of PIEZO2 IDR5, Flnb knockdown significantly decreased the resting blade conformation in the absence of a stimulus and allowed the blades to expand with expansive membrane stretch (Fig. 3e,f). We also performed live-cell single-molecule MINFLUX tracking and observed that Flnb knockdown significantly increased the diffusion rate of PIEZO2 (Fig. 3g–i and Extended Data Fig. 7). These data suggest that FLNB is a component of the molecular tether that links PIEZO2 to actin and is required for conferring selectivity to indentation forces.
PIEZO2 is more sensitive to cellular indentation than PIEZO15. To determine whether actin tethering through FLNB contributes to this heightened sensitivity, we measured mechanically evoked responses from cellular indentation with a blunt glass probe. In SWELL1-KO/FLNB-KO HEK293 cells, PIEZO2 showed reduced responses at all of the tested indentation depths (Fig. 3j), significantly lower peak current densities (Extended Data Fig. 8a) and a significantly higher gating threshold (Fig. 3k) compared with the control cells. These results demonstrate that FLNB confers heightened sensitivity to cellular indentation to PIEZO2. By contrast, PIEZO1 responses to both indentation and membrane stretch did not differ significantly between FLNB-KO and control cells (Extended Data Fig. 8b–d), indicating that PIEZO1 gating is independent of FLNB under these conditions. PIEZO2(ΔIDR5) also exhibited significantly reduced indentation responses and increased indentation threshold4, although to a larger degree than those observed for FLNB deletion (Fig. 3j,k). We suspect that deletion of IDR5 might disrupt the intrinsic structural mechanics of the channel or that FLNB functions as part of a larger protein complex that interacts with this domain.
Compared with the conformation of the membrane-free cryo-EM structure, PIEZO2 is significantly expanded in the cell membrane of PtK2 cells by 2.76 nm, on average, without stimulation (Fig. 3l). Notably, while actin disruption with cytochalasin D compacts the blades to almost exactly that of the cryo-EM structure on average, the more potent drug latrunculin A, along with IDR5 deletion and Flnb knockdown, decreased the blade conformation even further (Fig. 3l). This is surprising because the blades presumably experience the same membrane bending forces that expand the blades of PIEZO1 by ~7 nm on average16, yet we measure conformations even more compact on average than the membrane-free cryo-EM structure. This discrepancy could arise from the focused-refinement steps of the single-particle cryo-EM reconstruction of the blades of PIEZO214, which tends to overly weight conformations that align most readily rather than those that might reflect the true average conformation43. It could also arise, for example, from the presence of a separate unidentified binding protein that modulates the conformation of the blades. Overall, we propose that, if blade expansion correlates with channel open probability, a more expanded resting state resulting from FLNB tethering might be responsible for lowering the force threshold for gating by decreasing the distance the blades need to be deformed, thereby keeping it primed in a more sensitive state.
As FLNB is responsible for conferring selectivity and sensitivity to indentation forces in heterologous cells, we wondered whether it is present alongside PIEZO2 in peripheral mechanosensory neurons tuned to detect innocuous touch in the skin. We first used single-molecule fluorescence in situ hybridization (smFISH) to quantify Piezo2 and Flnb co-expression in mouse dorsal root ganglion (DRG) neuronal cell bodies positive for Ntrk2 or Ntrk3—markers that collectively cover most of the cutaneous low-threshold mechanoreceptors (LTMRs)44—and found 95% and 96% co-expression, respectively (Extended Data Fig. 9a–d). We next co-stained PIEZO2 and FLNB protein in fixed skin sections from Piezo2smFP-Flag knock-in mice using antibodies against endogenous FLNB and the smFlag epitope, focusing on two specialized mechanoreceptor terminals defined by these LTMR markers: Meissner corpuscles, which detect touch and low-frequency vibration in glabrous skin; and lanceolate endings, which encircle hair follicles in hairy skin to sense their deflection24. We found that FLNB and PIEZO2 co-localize prominently within both types of mechanoreceptor endings (Fig. 4a). To determine whether FLNB and PIEZO2 lie within a reasonable distance needed for direct interaction, we performed STED super-resolution imaging of lanceolate endings stained for PIEZO2 and FLNB with a full width at half maximum (FWHM) resolution of around 60–80 nm and quantified puncta overlap using intensity-profile correlations (Fig. 4b–e, Methods and Extended Data Fig. 9e–g). Analysis of FLNB and PIEZO2 intensity profiles in lanceolate endings yielded a mean Spearman’s rank correlation of ρ = 0.72 (Fig. 4e), indicating that the two proteins lie within just tens of nanometres of each other. This nanoscale proximity implies that FLNB is ideally positioned to tether PIEZO2, supporting a model in which they form a physically contiguous mechanotransduction complex that facilitates gating by low-threshold indentation forces.
a, Representative images of sectioned skin from Piezo2smFP-Flag mice that contain end-organs formed by Ntrk2+ and/or Ntrk3+ LTMRs: lanceolate endings around hair follicles from back skin (top, five sections from two mice) and Meissner corpuscles from glabrous skin of paw digits (bottom, six sections from one mouse). Each section was co-stained with antibodies against NFH, PIEZO2–Flag and FLNB. Scale bars, 10 μm. b, Representative super-resolution STED microscopy image of PIEZO2–Flag and FLNB immunostaining in lanceolate endings showing co-localization of single puncta (six sections from two mice). Scale bars, 10 μm. c, Isolated single lanceolates from the yellow boxes in b (representative images of six sections from two mice). Scale bars, 500 nm. d, FWHM resolution of all identified peaks. Mean ± s.d. FWHM: anti-PIEZO2–Flag = 83 ± 31 nm, anti-FLNB = 62 ± 19 nm. n = 201(PIEZO2) and n = 469 (FLNB) puncta. e, Quantification of colocalization using Spearman’s rank correlation value ρ = 0.72 ± 0.12 (mean ± s.d.). n = 50 lanceolates from 5 follicles and 2 mice. f, The amplitude of stretch-induced currents in dissociated large diameter (≥70 µm) DRG neurons without any treatment (control, n = 8 cells), nucleofected with non-targeting DsiRNA (n = 8 cells) or nucleofected with DsiRNAs targeting Flnb (n = 9 cells). n = 3 mice for each condition. Two-sided Kruskal–Wallis test with Dunn’s multiple-comparison test; P = 0.9999 (control versus non-targeting DsiRNA), *P = 0.0105 (control versus Flnb DsiRNA), *P = 0.0201 (non-targeting DsiRNA versus Flnb DsiRNA).
Finally, to test whether FLNB modulates the force selectivity endogenous PIEZO2 in somatosensory neurons, we recorded mechanically evoked currents from dissociated mouse DRG neurons. We restricted our analysis to large-diameter (≥70 µm) neurons, of which the mechanical responses are predominantly mediated by PIEZO245. We elicited expansive membrane stretch with osmotic swelling in the presence of the SWELL1 inhibitor DCPIB, but did not observe significant currents above the baseline (Fig. 4f). This indicates both that SWELL1 is sufficiently blocked by DCPIB, and that endogenous PIEZO2 does not respond to expansive membrane stretch. By contrast, DsiRNA-mediated Flnb knockdown elicited significant responses to expansive membrane stretch compared with control cells (Fig. 4f), indicating that FLNB is required for conferring force selectivity to PIEZO2 in somatosensory neurons.
Here we provide evidence that PIEZO2 acquires its exquisite sensitivity to and selectivity for cellular indentation from a physical tether to the cortical actin network through FLNB. This scaffold fundamentally alters how force is transmitted to the channel. Whereas the primary gating force for PIEZO1 is lateral membrane tension, PIEZO2 appears to instead sense deformation of the bilayer against its FLNB–actin linkage. This difference yields distinct mechanisms of activation, highlighted by the fact that identical mechanical stimuli drive opposite conformational and gating responses (Fig. 1d–k).
Even without FLNB, the structural mechanics of PIEZO1 and PIEZO2 are intrinsically different (Figs. 1b and 3e). The blades of PIEZO2 have far higher apparent rigidity compared with those of PIEZO1 because they explore a smaller distribution of conformational states and are bent significantly less by the curvature mismatch of the planar plasma membrane and bowl-shaped structure of the channel (Fig. 1b,c). Notably, PIEZO2 blades in cells are even more compacted than in the membrane-free cryo-EM structure (Fig. 3l), despite ostensibly experiencing the same bending forces that expand PIEZO1 blades by around 7 nm on average16. Future studies could use targeted mutagenesis of predicted high-affinity interfaces to pinpoint the regions that confer this rigidity and reveal their impact on gating mechanics.
FLNB tethering biases the blades of PIEZO2 into a pre-expanded state, which correlates with a lower activation threshold by cellular indentation (Fig. 3). This indicates that tethering makes the channel more sensitive to indentation forces by reducing the distance the blades need to be deflected to open the ion-conducting pore. In cells or tissues that naturally do not express FLNB, we therefore predict PIEZO2 to act as a higher-threshold sensor of membrane tension, consistent with its higher pressure activation threshold in cell-attached recordings26. Differentially expressing PIEZO1 and PIEZO2 along with FLNB or other modulators might be a basic mechanism by which cells can calibrate mechanical sensitivity across a wide dynamic range.
Filamins are approximately 280 kDa actin-scaffolding proteins that consist of three family members—FLNA, FLNB and FLNC40. Each protein contains an N-terminal actin-binding domain, two rod regions of 24 immunoglobulin-like repeats separated by a flexible hinge and a C-terminal self-association domain (Extended Data Fig. 6c). Filamins are broadly implicated in cytoskeletal organization and are proposed to function as actin filament cross-linkers that influence cell shape and mechanical properties40. Both strong cortical coupling to the membrane and a stiff, highly cross-linked cortex tends to inhibit mechanosensitive ion channels by dampening the propagation of membrane tension46,47,48. For example, FLNA deletion increases PIEZO1 activity in smooth muscle cells, probably through changes in cytoskeletal stiffness rather than direct tethering49. However, FLNB KO did not significantly affect PIEZO1 responses to indentation or membrane stretch (Extended Data Fig. 8b–d), suggesting that FLNB does not substantially impact cell stiffness in our conditions. Filamins also prominently act as a scaffold for membrane proteins such as integrins, β-spectrins, G-protein-coupled receptors and ion channels40. Consistent with this role, our results identify FLNB as a component of the scaffold required for a direct channel–actin connection.
FLNB is expressed in many cell types throughout the body and in a variety of immortalized cells lines50, which might explain why PIEZO2 appears to broadly retain its mechanosensitive specialization. Filamins are also regulated by various processes including calcium-dependent proteolysis, phosphorylation and mechanical unfolding51, which may in turn impact PIEZO2 function. For example, protein kinase A (PKA) modulates the activity of both PIEZO2 and filamins52,53. Notably, PKA modulation of PIEZO2 requires the cytoskeleton-binding IDR5 segment—despite the absence of PKA phosphorylation sites within this region—suggesting that FLNB could be the phosphorylation target52. This type of modulation might tune the PIEZO2–actin linkage dynamically and could be involved in switching PIEZO2 from a lower-threshold sensor of indentation to a higher-threshold sensor of membrane tension depending on the needs of the cell. Clinically, loss of FLNB function in humans and mice can cause perinatal respiratory distress, musculoskeletal defects and distal arthrogryposis44. These phenotypes significantly overlap with those caused by deleterious mutations in PIEZO210, suggesting shared physiological roles. Although it is beyond the scope of this current study, future studies should carefully examine how disruption of the PIEZO2–FLNB connection alters touch discrimination, proprioception and related behaviours.
In summary, we directly measured the force-dependent conformational changes of PIEZO2 during channel gating and established a direct link between the structural state of the channel and its function. Compared with PIEZO1, differences in intrinsic structural mechanics and actin tethering through FLNB fundamentally alter the way PIEZO2 is gated by mechanical force. These data lay the foundation for understanding how PIEZOs are functionally specialized to detect diverse mechanical stimuli. Peripheral mechanosensory neurons distinguish indentation, membrane tension, phasic displacement and osmotic pressure to encode touch, proprioception, vibration and bladder fullness. This functional diversity, despite a common reliance on PIEZO2, suggests that sensory end organs contain additional specialized ultrastructural features beyond FLNB, such as extracellular tethers or caveolae54,55, that modulate how PIEZO2 responds to mechanical stimuli, enabling them to generate specific sensory outputs. Identifying and characterizing these specialized ultrastructural features will be essential for defining the molecular basis of PIEZO2-mediated mechanotransduction.
No statistical methods were used to predetermine sample size and the sample size was based on a previous study16. All attempts at replication were successful, and all experiments were repeated more than once, as indicated in the figure legends. The experiments were not randomized, and investigators were not blinded to allocation during experiments and outcome assessment. For MINFLUX, all experiments were repeated at least three times with separate biological and technical replicates, imaged over at least two separate days. Label-free controls were included to ensure signal specificity. For electrophysiology, experiments were conducted as previously described without blinding1,6,16. Untransfected control groups were measured on each day of experimentation, and each separate manipulation was paired with wild-type PIEZO1 and PIEZO2 control measurements.
The coding sequence of mouse PIEZO2 (UniProtKB: Q8CD54) was codon optimized, synthesized and cloned into the pcDNA3.1 plasmid. For imaging and MS experiments, an amber stop codon was inserted after amino acid 104 (TCO*K 105) through site-directed mutagenesis using the Q5 Site-Directed Mutagenesis Kit (New England Biolabs), and a C-terminal HaloTag and Strep-Tag II. Labelled PIEZO1 plasmids with a tag after position 102 (TCO*K-103) were prepared the same way from mouse PIEZO1 (UniProtKB: E2JF22), as described previously16. For genetic code expansion, the tRNA and tRNA synthetase expression plasmid of pNEU-hMbPylRS-4xU6M15 (Addgene, 105830) was modified to have a mNeonGreen sequence upstream of the tRNA synthetase sequence separated by a T2A self-cleaving peptide to mark transfected cells. For electrophysiology experiments, codon-optimized mouse Piezo2 was cloned into the pcDNA3.1 vector upstream of an IRES mNeonGreen sequence, and mouse Piezo1 was cloned into the pcDNA3.1 vector upstream of an IRES eGFP sequence. PIEZO2(ΔIDR5) was created by deleting the coding sequence of amino acids 621–673 as described previously4. The PIEZO1 + IDR5 chimera was created by replacing the fifth IDR of PIEZO1 (amino acids 551–575) with the corresponding IDR5 region from PIEZO2 (amino acids 620–672). The sequences of each plasmid were verified using whole-plasmid sequencing (Plasmidsaurus). All DNA sequences were viewed and designed in SnapGene software (Dotmatics).
#1.5 D263 borosilicate coverglass (Warner Instruments) were cleaned by boiling in 1% Hellmanex III detergent (Hellma) in MilliQ water and sonicating for 15 min in a water bath sonicator. The coverslips were washed five times with MilliQ water, exchanged into 100% ethanol and then dried and placed onto a sheet of 4 in × 4 in × 1/8 in 304 stainless steel. Then, 150 nm gold nanoparticles with Nanopartz Surface Polymer (Nanopartz) were prepared by diluting to 5 µg ml−1 in 100% ethanol and sonicated in a bath sonicator to break up aggregates. This solution was applied to the coverslips at 0.079 µl mm−2 of surface area and allowed to dry. The coverslips were then covered with a borosilicate glass Petri dish and placed into a muffle furnace. The furnace was heated to 600 °C at a rate of 30 °C min−1, held at this temperature for 5 h and then allowed to cool overnight. The coverslips were stored at room temperature until use. Immediately before plating cells, the coverslips were coated with a 1:100 dilution of LDEV-free Matrigel (Corning) in DMEM (Thermo Fisher Scientific).
Cell preparation for structural MINFLUX imaging
PtK2 cells (ATCC, CCL-56) were maintained at 37 °C with 5% CO2 in minimum essential medium (MEM) supplemented with 2 mM GlutaMAX, 25 mM HEPES (Thermo Fisher Scientific), 10% FBS, 1 mM sodium pyruvate (Gibco), 1× MEM non-essential amino acids solution (Gibco) and 100 µg ml−1 penicillin and streptomycin. Cells were authenticated by the supplier by morphological analysis, species verification by isoenzymology, short-tandem-repeat profiling and mycoplasma testing. Cells were further verified to be free of mycoplasma using the using the MycoAlert Mycoplasma Detection Kit (Lonza). The cells were plated onto Matrigel-coated coverslips with embedded gold fiducials, exchanged into a medium containing 250 µM of the click amino acid trans-cyclooct-2-en-l-lysine (axial isomer) (SiChem), and transfected with 1 µg of an equimolar ratio of PIEZO expression plasmid and of the tRNA/tRNA synthetase expression plasmids using TransfeX transfection reagent (ATCC). After 48 h, the cells were washed four times with prewarmed medium in 15 min intervals to remove excess click amino acid. The cells were washed in prewarmed 1× PBS and then fixed in prewarmed 1× PBS containing 0.8% PFA and 0.1% glutaraldehyde for 15 min.
For osmotic stimulation experiments, the cells were washed in 1× PBS and then exposed to a modified Ringer’s solution at 120 mOsm (48.8 mM NaCl, 5 mM KCl, 10 mM HEPES (pH 7.40) and 10 mM D-glucose) or at 480 mOsm (140 mM NaCl, 5 mM KCl, 10 mM HEPES (pH 7.40), 10 mM D-glucose and 190.3 mM mannitol) for 2.5 min at room temperature. The cells were then fixed in the same osmotic solution containing 0.8% PFA and 0.1% glutaraldehyde for 15 min and quenched in 1× PBS containing 25 mM Tris, pH 8.0. The osmolality of all solutions was determined to be ±5 mOsm using a vapour pressure osmometer.
For experiments with cytochalasin D or latrunculin A, a stock solution of 10 mM in DMSO was diluted to 10 µM in prewarmed medium and added to the cells. After incubation at 37 °C for 30 min, the cells were washed and fixed as described above, except each solution, including fixatives, contained 10 µM cytochalasin D or latrunculin A.
After fixation, all of the coverslips were washed in 1× PBS and quenched with 1× PBS + 25 mM Tris pH 8.0 for 10 min. The coverslips were then blocked in 1× PBS + 1% BSA for 10 min, PIEZOs were labelled with a custom DNA PAINT docking strand modified with a 3′ tetrazine (Supplementary Table 1) at 1 µM in blocking solution for 15 min and washed with blocking solution and 1× PBS. After labelling, cells were washed with and mounted in DNA PAINT imaging buffer (1× PBS + 500 mM NaCl + 0.5 mM EDTA) containing an enzymatic oxygen-scavenging system of 3,4-dihydroxybenzoic acid and protocatechuate 3,4-dioxygenase (from Pseudomonas) in addition to the triplet-state quencher Trolox ((+/−)−6-hydroxy-2,5,7,8-tetra-methylchromane-2-carboxylic acid) as described previously56. This imaging solution containing 1–10 nM of a custom, complementary fluorogenic DNA PAINT imaging strand modified with a 5′ ATTO 643 dye and a 3′ IowaBlack fluorescence quencher (Supplementary Table 1). The coverslip was placed onto a glass slide containing a cavity well (Globe Scientific) filled with imaging buffer and was then sealed onto the slide using Elite Double 22 dental epoxy (Zhermack).
For tracking single PIEZO ion channels, the cells were transfected and prepared as for structural MINFLUX imaging. After washing away excess click amino acid, the cells were labelled with 0.5–2 nM Janelia Fluor 635-HaloTag ligand (Janelia Materials) in culture medium for 15 min at 37 °C, and then washed several times with fresh medium before incubating the cells for 30 min at 37 °C. This labelling concentration was chosen to obtain sparsely labelled channels conjugated to single dyes with non-overlapping fluorescent puncta. After another wash step, the cells were maintained at 37 °C for up to 4 h before imaging. Immediately before imaging, the cells were exchanged into supplemented culture medium without Phenol Red and mounted and sealed onto a glass slide with a cavity well as described above. The coverslip was imaged for a maximum of 1 h before discarding.
MINFLUX data were acquired on the commercial MINFLUX 3D microscope an Olympus IX83 microscope body (Abberior Instruments) using Imspector software (v.16.3.15645-m2205) with MINFLUX drivers. A ×100 oil-immersion objective lens (UPL SAPO100XO/1.4, Olympus) and a 642-nm excitation laser was used for imaging. Transfected cells were identified by expression of the mNeonGreen fluorescent marker driven by the tRNA/tRNA synthetase plasmid. A field of view around the cell was chosen containing at least three separate embedded gold nanoparticles for active sample stabilization through back-scattering from a 980 nm laser source through a closed control loop, typically resulting in less than 1 nm mean s.d. in the x,y,z axes. A 5–25 µm2 region of interest (ROI) was chosen at the top face of the flat extension of a PtK2 cell. For structural MINFLUX imaging, at least three isolated gold fiducial nanoparticles were chosen for use by the active beamline stabilization system, and the localization error was verified to be less than 5 nm for each fiducial. The sample was imaged using a 5–12% 642-nm laser power, measured to be around 4.30 µW per percent set power at the sample plane. The pinhole diameter was set to be 0.47–0.6 a.u. The total measurement time varied between 5 and 24 h. For MINFLUX tracking, the sample was imaged using 2% 642-nm excitation laser power with a pinhole diameter of 0.8 a.u.
MINFLUX data analysis for 3D structural imaging in fixed cells
MINFLUX data analysis for 3D tracking in live cells
For MINFLUX tracking experiments, raw valid localizations from the final targeting iteration of the 3D tracking sequence (Supplementary Table 3) were exported from Imspector as .mat files, imported into MATLAB and analysed using custom MATLAB analysis code to analyse tracks and obtain diffusion coefficients. For each localization, we used the x, y and z coordinates, the trace identifier, the time stamps and the EFO. A 0.7 refractive index correction factor was applied to z values. Localizations were grouped by trace ID to isolate individual trajectories. To ensure robust MSD estimation from well-localized single emitters, tracks were prefiltered using empirical thresholds that were kept fixed across all conditions. A maximum EFO cut-off of 130,000 was applied. The EFO cut-off ensured that only single dyes were imaged, as the photon emission frequency peak of a single dye was determined to be around 75 kHz, and we observed a second emission peak at approximately twice the single-dye emission frequency (~150 kHz) corresponding to two dyes, as described in a previous report that similarly used 3D MINFLUX tracking and an under-labelling strategy58 (Extended Data Fig. 5a,b). A maximum allowed time gap of 18 ms between successive localizations was imposed, and any trajectory was truncated at the first gap exceeding this threshold, preventing artificial linking of positions across long dark periods. Trajectories were required to have greater than 200 localizations per trajectory so that the MSD could be computed over a sufficiently long timescale.